Download
1 / 15
180 likes | 412 Views
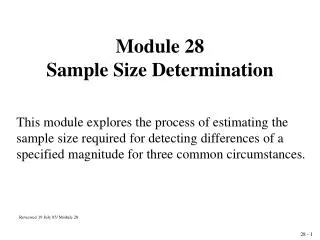
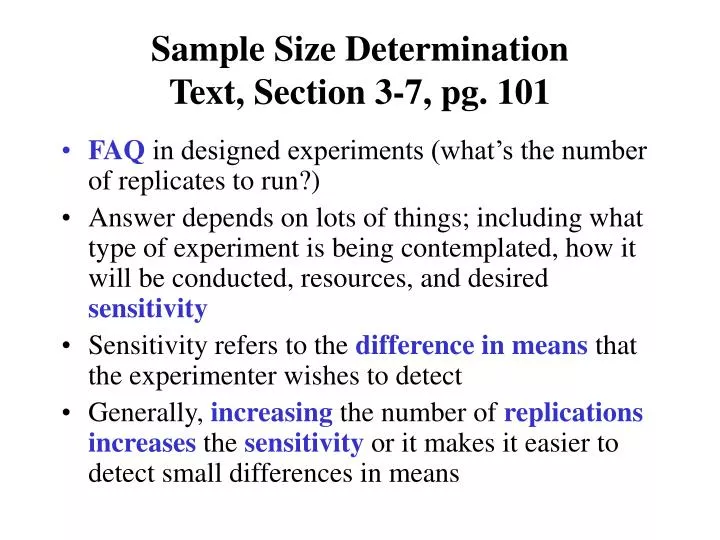
Sample Size Determination Text, Section 3-7, pg. 101. FAQ in designed experiments (what’s the number of replicates to run?) Answer depends on lots of things; including what type of experiment is being contemplated, how it will be conducted, resources, and desired sensitivity

E N D
Sample Size DeterminationText, Section 3-7, pg. 101 • FAQ in designed experiments (what’s the number of replicates to run?) • Answer depends on lots of things; including what type of experiment is being contemplated, how it will be conducted, resources, and desired sensitivity • Sensitivity refers to the difference in means that the experimenter wishes to detect • Generally, increasing the number of replicationsincreases the sensitivity or it makes it easier to detect small differences in means
Choice of sample size is closely related to the probability of type II error b. • Hypotheses • Ho: m1 = m2 • H1: m1m2 • Type I error – reject H0 when it is true (a) • Type II error – fail to reject H0 when it is false (b) • Power = 1 – b =P(Reject HoHo is false) • =P(Fo > Fa,a-1,N-aHo is false) • The probability of type II error depends on the true difference in means d = m1 - m2
Operating Characteristic Curves forFixed Effects/Equal Sample Sizes per Treatment Case • Operating characteristic curves plot b against a parameter F where • F is related to d. It depends on a (0.01 and 0.05) and degrees of freedom for numerator (a-1) and denominator (N-a). • Assumptions and trials are needed to use the curves
s2can be estimated through prior experience/ previous experiment/preliminary test/judgment, or assuming a range of likely values of s2. • ith treatment effect • where Assumed mi’s can be used for which we would like to reject the null hypothesis with high probability • Example (etch rate experiment) If the experimenter is interested in rejecting the null hypothesis with a probability of at least 0.90 if the five treatment means are m1 = 575 m2 = 600 m3 = 650 m4 = 675
a = 0.01is planned • a = 4, N = an = 4n, a – 1 = 3, N – a = 4(n-1) • is calculated using assumed mi’s • s is assumed no larger than 25 • Find the right plot: • a – 1 = 3 (= v1) determines the use of the upper plot on page 614 (Appendix Chart V) • Because a = 0.01the curves on the right side are used
Chart V. Operating characteristic curves for the fixed effects model analysis of variance (Page 614) the upper graph with v1=3 should be used.
The objective is to find a b to see if the power is satisfied • It needs v2 (or n) to determine the particular curve, and a value of F to determine b • Therefore, at least n = 4
It is often difficult to select a set of treatment means for choosing the sample size • A very common way to use these charts is to define a difference in two means D of interest, then the minimum value of F2 is • Typically work in term of the ratio of D/s and try values of nuntil the desiredpower is achieved
Other Methods of Determining Sample Sizes • Specifying a Standard Deviation Increase • As the difference between means increase, the standard deviation increases • Choose a percentage P for the increase in s of an observation beyond which the null hypothesis is rejected, equivalently
Specifying a Standard Deviation Increase (continued) • Rearrange it, • Therefore, F can be expressed as • Specify P, a, and the probability to reject the null hypothesis, then determine n.
Confidence Interval Estimation Method • Specify in advance how wide the confidence intervals should be by specifying the accuracy of the confidence interval • No OC curves are needed. Example: the etch rate experiment. • Need a and N (an) to determine ta/2,N-a, and s to estimate MSE • Specify the level of confidence (95%, or a =0.05), difference in mean to be determined (30Å/min), and (prior) estimate s2 (252 =625)
Confidence Interval Estimation Method (continued) • Procedure: compare the accuracy with an assumed n, with the specified accuracy (30Å/min) • When n = 5, ta/2,N-a =2.120, • When n = 6, ta/2,N-a =2.086, • When n = 7, ta/2,N-a =2.064,
Dispersion Effects • Focus is location effects so far using ANOVA: factor level means and their differences • It needs constant variances. If not, using transformations to stabilize the variances. • Sometime the dispersion effects are of interest: whether the different factor levels affect variability • In such analysis, standard deviation, variance, or other measures of variability are used as response variables
An Example – Al Smelting Experiment • A reaction cell: Alumina and other ingredients (with a certain ratio) under electric resistance heating • Four different ratio control algorithms • Cell voltage is recorded (thousands of voltage measurements during each run) • A run consists of one ratio control algorithm • Average cell voltage (affecting cell temperature), and the standard deviation of cell voltage over a run (affecting overall cell efficiency) are response variables
Observations Ratio Control Algorithm • An ANOVA determines that the ratio control algorithm had no location effects (the ratio control algorithm does not change the average cell voltage) • A transformation is used to study the dispersion effects • y = -ln(s) • A standard ANOVA can be done on y, the natural logarithm of standard deviation -> algorithm 3 produces different standard deviation than others