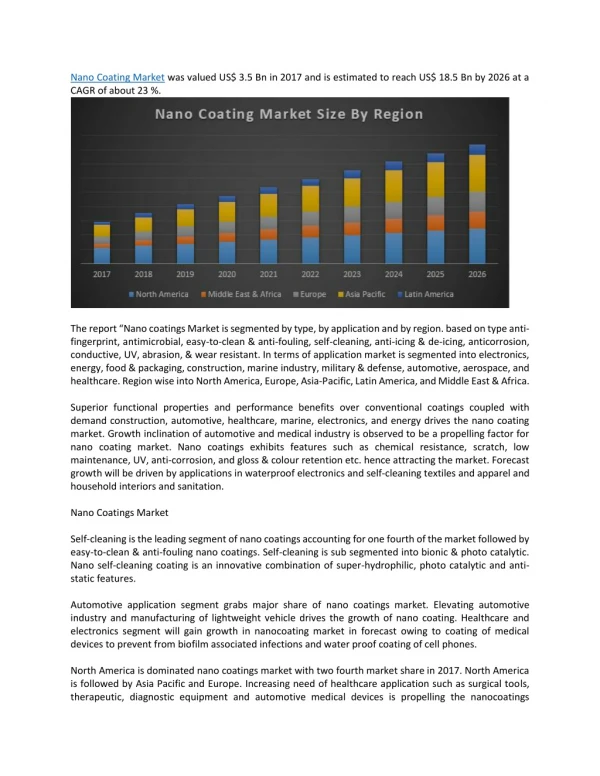
Download

1 / 19
190 likes | 203 Views
Nano Satellite Market is estimated to grow at a CAGR of 13.43% during 2018-2023. Nano Satellite Industry has been segmented into five end-users: academic, commercial, government, defence, and non-profit organization.<br>Read Report Overview: https://bisresearch.com/industry-report/nano-satellite-market.html<br>Get Free Sample: https://bisresearch.com/requestsample?id=586&type=download

E N D
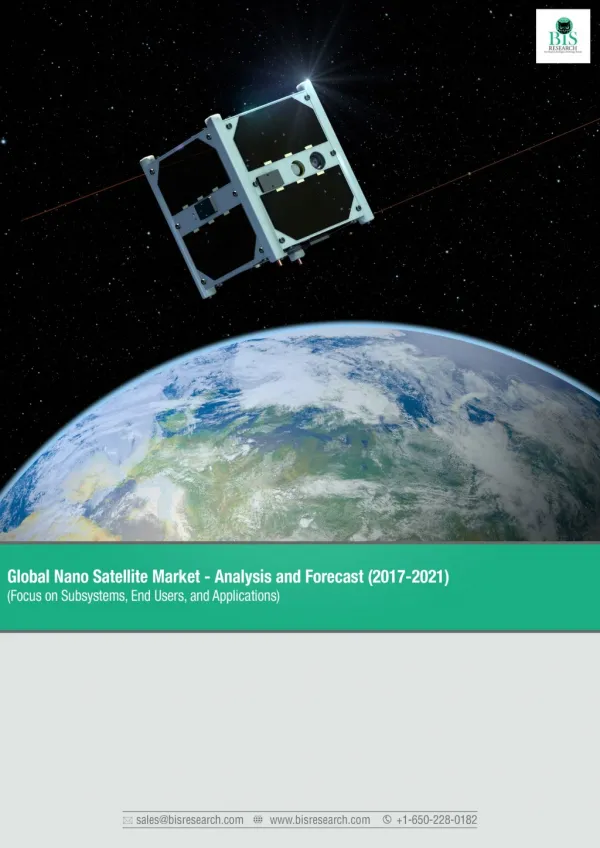
Global Nano Satellite Market-Analysis and Forecast, 2018-2023 BIS Research is a leading market intelligence and technology research company. BIS Research publishes in-depth market intelligence reports focusing on the market estimations, technology analysis, emerging high-growth applications, deeply segmented granular country-level market data and other important market parameters useful in the strategic decision making for senior management. BIS Research provides multi-client reports, company profiles, databases, and custom research services. Copyright © 2018 BIS Research All Rights Reserved. This document contains highly confidential information and is the sole property of BIS Research. Disclosing, copying, circulating, quoting, or otherwise reproducing any or all contents of this document is strictly prohibited. Access to this information is provided exclusively for the benefit of the people or the organization concerned. It may not be accessed by or offered to, whether for sale or otherwise, any third party. 2
Global Nano Satellite Market-Analysis and Forecast, 2018-2023 Preface Nano Satellite has evolved as a product of technological advances and miniaturization in the satellites. In the past five years, satellites have rapidly transitioned from a phase of cost up to $1million to $500,000 which is anticipated to reduce even further over the coming years. This factor has largely driven the market and is expected to remain a predominant factor for the end users over the coming years. The nano satellite market research study offers a wide perspective on the analysis of the industry. The research is based on extensive primary interviews (in-house experts, industry leaders, and market players) and secondary research (a host of paid, and unpaid databases), along with the analytical tools, that have been used to build the forecast and the predictive models. This work was designed to answer some of the most crucial questions of the global nano satellite market: What is the global nano satellite market size in terms of satellite launches, and revenue ($Million) from 2018-2023? Which end user is dominant in the nano satellite market in the forecast period? What is the revenue generated by the different applications wherein nano satellite applications are operational? The report is a compilation of various segmentations including market breakdown by end user such as defense academic, commercial, government, and non-profit organization. While highlighting the key driving and restraining forces for this market, the report also provides a detailed study of the applications such as communication, earth observation and remote sensing, space exploration, and technology development and demonstration. The report is based on discussions and interviews with the top management of several leading nano satellite market operators, manufacturers, and tier 1 suppliers. The nano satellite market is not expected to play out the same way for every region or end user, so this report segments the market accordingly and breaks down the industry regionally as follows: North America (the U.S and Canada), Europe (the U.K, Russia, France, Denmark, Germany, and Rest-of-Europe), Asia-Pacific (China, India, Japan, South Korea, and Rest-of-APAC), Latin America, Middle East and Africa, and others. Each geographical region analysis details the individual push and pull forces in addition to the key players from that particular region. BIS Aerospace And Defense, October 2018 3
Global Nano Satellite Market-Analysis and Forecast, 2018-2023 Table of Contents Executive Summary ................................................................................. 21 1Market Dynamics ................................................................................ 32 1.1 Market Drivers .......................................................................... 33 1.1.1 Growing Demand for Cost-Effective Satellites .............. 33 1.1.2 Increasing Capability of Electronic Technology ............ 34 1.1.3 Ascending Demand for Small Satellite Constellations .............................................................. 35 Market Challenges .................................................................... 36 1.2.1 Developing Safe, Low-Cost, and Small Payload Nano Satellite to Launch Beyond Low-Earth Orbit ........ 36 1.2.2 Removal of Space Debris .............................................. 36 Market Opportunities ................................................................ 37 1.3.1 Growth of Nano Satellite in Disaster Management Applications ................................................................. 37 1.3.2 Development of Independent Global Navigation Satellite System (GNSS)............................................... 39 1.3.3 Emergence of Composite Material in Nano Satellites Structure ...................................................................... 40 1.3.4 Development of Autonomous Nano Satellites ............... 40 1.2 1.3 2Competitive Insights .......................................................................... 42 2.1 2.2 Overview .................................................................................. 42 Key Market Strategies and Developments ................................ 44 2.2.1 Partnerships, Agreements, and Contracts .................... 44 2.2.2 Product Launches ......................................................... 45 2.2.3 Mergers and Acquisitions ............................................. 46 2.2.4 Other Developments .................................................... 47 Competitive Benchmarking ....................................................... 48 2.3 3Industry Analysis ............................................................................... 51 3.1 Technological Scenario and Patent Analysis ............................. 51 4
Global Nano Satellite Market-Analysis and Forecast, 2018-2023 3.1.1 Technological Scenario ................................................ 51 3.1.1.1 3D Printed Nano Satellite .......................................... 51 3.1.1.2 On-Board Internet System Powered Nano Satellite ....... 52 3.1.2 Patent Analysis ............................................................ 53 Startup’s and Investment Scenario .......................................... 56 Value Chain Analysis ................................................................ 62 Industry Attractiveness ............................................................ 63 3.4.1 Bargaining Power of Suppliers ..................................... 64 3.4.2 Bargaining Power of Buyers ......................................... 66 3.4.3 Threat of New Entrants ................................................ 67 3.4.4 Threat of Substitutes ................................................... 69 3.4.5 Intensity of Competitive Rivalry ................................... 70 3.2 3.3 3.4 4Global Nano Satellite Market .............................................................. 73 4.1 4.2 Assumptions and Limitations .................................................... 73 Market Overview ...................................................................... 74 5Global Nano Satellite Market (by Application) .................................... 76 5.1 5.2 5.3 5.4 5.5 Market Overview ...................................................................... 77 Communication ......................................................................... 79 Earth Observation and Remote Sensing .................................... 81 Space Exploration ..................................................................... 84 Technology Development and Demonstration ........................... 87 6Global Nano Satellite Market (by End User) ........................................ 90 6.1 6.2 Market Overview ...................................................................... 91 Academic .................................................................................. 94 6.2.1 Global Nano Satellite Market Analysis for Academic End User (by Application) ............................................ 94 Commercial .............................................................................. 96 6.3.1 Global Nano Satellite Market Analysis for Commercial End User (by Application) ......................... 96 Government .............................................................................. 98 6.3 6.4 5
Global Nano Satellite Market-Analysis and Forecast, 2018-2023 6.4.1 Global Nano Satellite Market Analysis for Government End User (by Application) ........................ 98 Defense .................................................................................. 100 6.5.1 Global Nano Satellite Market Analysis for Defense End User (by Application) .......................................... 100 Non-Profit Organization .......................................................... 102 6.6.1 Global Nano Satellite Market Analysis for Non- Profit Organization End User (by Application) ............ 102 6.5 6.6 7Global Nano Satellite Market (by Mass) ............................................ 104 7.1 7.2 Market Overview .................................................................... 105 1kg-3kg Nano Satellite ........................................................... 106 7.2.1 Global 1kg-3kg Nano Satellite Market Analysis (by Application) ............................................................... 107 4kg-6kg Nano Satellite ........................................................... 108 7.3.1 Global 4kg-6kg Nano Satellite Market Analysis (by Application) ............................................................... 109 7kg-10kg Nano Satellite ......................................................... 110 7.4.1 Global 7kg-10kg Nano Satellite Market Analysis (by Application) ............................................................... 111 7.3 7.4 8Global Nano Satellite Market (by Subsystem) ................................... 112 8.1 8.2 8.3 8.4 8.5 8.6 8.7 8.8 Market Overview .................................................................... 113 Payload .................................................................................. 115 Structure ................................................................................ 116 Telecommunication ................................................................ 117 On-Board Computer ................................................................ 119 Power System ......................................................................... 120 Attitude Control System ......................................................... 121 Propulsion System .................................................................. 122 9Global Nano Satellite Market (by Region) ......................................... 124 9.1 9.2 Market Overview .................................................................... 125 North America ........................................................................ 127 6
Global Nano Satellite Market-Analysis and Forecast, 2018-2023 9.2.1 North America Nano Satellite Market Analysis (by End User) ................................................................... 128 U.S. ............................................................................ 129 Canada ....................................................................... 130 Europe .................................................................................... 131 9.3.1 Europe Nano Satellite Market Analysis (by End User) .......................................................................... 132 9.3.2 U.K. ............................................................................ 133 9.3.3 Germany .................................................................... 134 9.3.4 France ........................................................................ 135 9.3.5 Russia ........................................................................ 136 9.3.6 Denmark .................................................................... 137 9.3.7 Rest-of-Europe ........................................................... 138 Asia-Pacific ............................................................................. 139 9.4.1 Asia-Pacific Nano Satellite Market Analysis (by End User) .......................................................................... 140 9.4.2 China .......................................................................... 142 9.4.3 India .......................................................................... 143 9.4.4 Japan ......................................................................... 144 9.4.5 South Korea ............................................................... 144 9.4.6 Rest-of-Asia-Pacific ................................................... 145 Rest-of-the-World .................................................................. 146 9.5.1 Rest-of-the-World Nano Satellite Market Analysis (by End User) ............................................................. 147 9.5.2 Middle East ................................................................ 148 9.5.3 Latin America ............................................................. 149 9.5.4 Africa ......................................................................... 150 9.2.2 9.2.3 9.3 9.4 9.5 10Company Profile ............................................................................... 151 10.1Ball Corporation ...................................................................... 152 10.1.1Company Overview .................................................... 152 10.1.2Product Offerings ....................................................... 153 7
Global Nano Satellite Market-Analysis and Forecast, 2018-2023 10.1.3Financials ................................................................... 154 10.1.3.1Overall Financials .................................................. 154 10.1.3.2Financial Summary ................................................ 156 10.1.4SWOT Analysis ........................................................... 157 10.2Clyde Space Ltd. ..................................................................... 158 10.2.1Company Overview .................................................... 158 10.2.2Product Offerings ....................................................... 159 10.2.3SWOT Analysis ........................................................... 160 10.3GomSpace A/S ....................................................................... 161 10.3.1Company Overview .................................................... 161 10.3.2Product Offerings ....................................................... 162 10.3.3Financials ................................................................... 163 10.3.3.1Overall Financials .................................................. 163 10.3.3.2Financial Summary ................................................ 164 10.3.4SWOT Analysis ........................................................... 165 10.4Innovative Solutions In Space BV ........................................... 166 10.4.1Company Overview .................................................... 166 10.4.2Product Offerings ....................................................... 167 10.4.3SWOT Analysis ........................................................... 168 10.5Israel Aerospace Industries Ltd. ............................................ 169 10.5.1Company Overview .................................................... 169 10.5.2Product Offerings ....................................................... 170 10.5.3Financials ................................................................... 171 10.5.3.1Overall Financials .................................................. 171 10.5.3.2Financial Summary ................................................ 172 10.5.4SWOT Analysis ........................................................... 173 10.6Lockheed Martin Corporation .................................................. 174 10.6.1Company Overview .................................................... 174 10.6.2Product Offerings ....................................................... 175 10.6.3Financials ................................................................... 176 8
Global Nano Satellite Market-Analysis and Forecast, 2018-2023 10.6.3.1Overall Financials .................................................. 176 10.6.3.2Financial Summary ................................................ 178 10.6.4SWOT Analysis ........................................................... 179 10.7NanoAvionika, LLC .................................................................. 180 10.7.1Company Overview .................................................... 180 10.7.2Product Offerings ....................................................... 181 10.7.3SWOT Analysis ........................................................... 182 10.8Northrop Grumman Corporation ............................................. 183 10.8.1Company Overview .................................................... 183 10.8.2Product Offerings ....................................................... 184 10.8.3Financials ................................................................... 185 10.8.3.1Overall Financials .................................................. 185 10.8.3.2Financial Summary ................................................ 186 10.8.4SWOT Analysis ........................................................... 187 10.9OHB SE ................................................................................... 188 10.9.1Company Overview .................................................... 188 10.9.2Product Offerings ....................................................... 189 10.9.3Financials ................................................................... 190 10.9.3.1Overall Financials .................................................. 190 10.9.3.2Financial Summary ................................................ 191 10.9.4SWOT Analysis ........................................................... 192 10.10Planet Labs, Inc. ..................................................................... 193 10.10.1Company Overview .................................................... 193 10.10.2Product Offerings ....................................................... 194 10.10.3SWOT Analysis ........................................................... 195 10.11QinetiQ Group PLC .................................................................. 196 10.11.1Company Overview .................................................... 196 10.11.2Product Offerings ....................................................... 197 10.11.3Financials ................................................................... 198 10.11.3.1Overall Financials .................................................. 198 9
Global Nano Satellite Market-Analysis and Forecast, 2018-2023 10.11.3.2Financial Summary ................................................ 199 10.11.4SWOT Analysis ........................................................... 200 10.12Sky and Space Global Ltd. ....................................................... 201 10.12.1Product Offering ........................................................ 201 10.12.2Financial Summary ..................................................... 201 10.12.3SWOT Analysis ........................................................... 202 10.13Space Systems/Loral, LLC (SSL) ............................................. 203 10.13.1Company Overview .................................................... 203 10.13.2Product Offerings ....................................................... 204 10.13.3SWOT Analysis ........................................................... 205 10.14The Boeing Company .............................................................. 206 10.14.1Company Overview .................................................... 206 10.14.2Product Offerings ....................................................... 207 10.14.3Financials ................................................................... 208 10.14.3.1Overall Financials .................................................. 208 10.14.3.2Financial Summary ................................................ 209 10.14.4SWOT Analysis ........................................................... 211 10.15Tyvak Nano-Satellite Systems, Inc. ........................................ 212 10.15.1Company Overview .................................................... 212 10.15.2Product Offerings ....................................................... 213 10.15.3SWOT Analysis ........................................................... 214 10.16Other Key Players ................................................................... 215 10.16.1Aerial Maritime .......................................................... 215 10.16.2Aistech Space ............................................................. 216 10.16.3EnduroSat AD ............................................................. 217 10.16.4Harris Corporation ..................................................... 218 10.16.5Kepler Communications ............................................. 219 10.16.6NanoRacks LLC ........................................................... 220 10.16.7Pumpkin Space .......................................................... 221 10.16.8Satellogic ................................................................... 222 10
Global Nano Satellite Market-Analysis and Forecast, 2018-2023 10.16.9Spire Global Inc. ........................................................ 223 10.16.10 Surrey Satellite Technology ................................ 224 11Research Scope and BIS Methodology .............................................. 225 11.1Scope of the Report ................................................................ 225 11.2Global Nano Satellite Market Research Methodology .............. 225 11.3Assumptions and Limitations .................................................. 230 12Appendix .......................................................................................... 231 12.1Related Reports ...................................................................... 231 11
Global Nano Satellite Market-Analysis and Forecast, 2018-2023 List of Tables Table 3.1 Patent Analysis: Small Satellite Capable of Formation Flying, and Formation of Multiple Small Satellites Table 3.2 Patent Analysis: Camera Used for CubeSat, Antenna Integration System and Antenna Expansion Method Table 3.3 Patent Analysis: Nano Satellite to Acquire High-Resolution Image Table 3.4 Patent Analysis: Modular Nano Satellite Platform Table 3.5 Patent Analysis: Compact Nano Satellite Sensor Table 3.6 Start-up’s and Investment Scenario Table 4.1 Payload Ranges for Satellites Table 5.1 Nano Satellite Launches for Communication Application in 2017 Table 5.2 Nano Satellite Launches for Earth Observation and Remote Sensing Application in 2017 82 Table 5.3 Nano Satellite Launches for Space Exploration Application in 2017 Table 5.4 Nano Satellite Launches for Technology development and demonstration Application in 2017 Table 6.1 Global Nano Satellite Market (by End User), $Million, 2017-2023 Table 8.1 Global Nano Satellite Market (by Subsystem), $Million, 2017-2023 Table 9.1 Global Nano Satellite Market Size (by Region), $Million, 2017-2023 53 54 54 55 56 57 74 80 85 88 92 113 126 12
Global Nano Satellite Market-Analysis and Forecast, 2018-2023 List of Figures Figure 1 Contribution by Space Agencies in Nano Satellite Market Figure 2 Global Nano Satellite Market Overview, 2018 and 2023 Figure 3 Global Nano Satellite Market, 2017-2023 Figure 4 Global Nano Satellite Market (by Subsystem), $Million, 2017 and 2023 Figure 5 Global Nano Satellite Market (by End-User), 2017 and 2023 Figure 6 Global Nano Satellite Market (by Application), 2017-2023 Figure 7 Global Nano Satellite Market (by Mass), 2017-2023 Figure 8 Global Nano Satellite Market (by Region), 2017-2023 Figure 1.1 Global Nano Satellite Market: Impact Analysis on Market Drivers, Challenges, and Opportunities Figure 1.2 Nano Satellite: Growth Roadmap Figure 1.3 Major Currently Operational or Announced Small Satellite Constellations Figure 1.4 Nano Satellite: Remote Sensing for Disaster Management Figure 1.5 GNSS Operational Constellations Figure 2.1 Some of the Organic and Inorganic Growth Strategies Adopted by the Key Players Figure 2.2 Percentage Share of Strategies Adopted by the Market Players, 2014-2018 Figure 2.3 Partnerships, Agreements, and Contracts Adopted by Key Market Players, 2015-2018 45 Figure 2.4 Product Launches by the Key Market Players, 2015-2018 Figure 2.5 Mergers and Acquisitions Adopted by the Key Market Players, 2017 Figure 2.6 Other Developments by the Key Market Players, 2015-2018 Figure 2.7 Nano Satellite: Competitive Benchmarking Figure 3.1 3D Printing Scenario for Different Industries Figure 3.2 Nano Satellite: Value Chain Analysis Figure 3.3 Nano Satellite: Porter’s Five Forces Figure 3.4 Bargaining Power of Suppliers Figure 3.5 Bargaining Power of Buyers Figure 3.6 Threat of New Entrants Figure 3.7 Threat of Substitutes Figure 3.8 Intensity of Competitive Rivalry Figure 4.1 Global Nano Satellite Market, 2017-2023 Figure 5.1 Classification of Global Nano Satellite Market (by Application), Market Share (%) 2017 77 Figure 5.2 Global Nano Satellite Market (by Application), 2017 and 2023 Figure 5.3 Global Nano Satellite Market (by Communication Application), 2017-2023 22 24 25 26 27 28 29 30 32 33 35 38 39 43 44 46 47 48 49 52 62 64 65 67 68 70 72 75 78 79 13
Global Nano Satellite Market-Analysis and Forecast, 2018-2023 Figure 5.4 Nano Satellite Market for Earth Observation and Remote Sensing Application Figure 5.5 Global Nano Satellite Market (by Earth Observation and Remote Sensing Application), 2017-2023 Figure 5.6 Global Nano Satellite Market (by Space Exploration Application), 2017-2023 Figure 5.7 Global Nano Satellite Market (by Technology Development and Demonstration Application), 2017-2023 Figure 6.1 Classification of Global Nano Satellite Market (by End User and Key Players ) Figure 6.2 Global Nano Satellite Market (by End User), 2017 and 2023 Figure 6.3 Global Nano Satellite Market (by Academic End User), 2017-2023 Figure 6.4 Global Nano Satellite Market Analysis for Academic End User (by Application), $Million, 2017 and 2023 Figure 6.5 Global Nano Satellite Market (by Commercial End User), 2017-2023 Figure 6.6 Global Nano Satellite Market Analysis for Commercial End User (by Application), $Million, 2017 and 2023 Figure 6.7 Global Nano Satellite Market (by Government End User), 2017-2023 Figure 6.8 Global Nano Satellite Market Analysis for Government End User (by Application), $Thousand, 2017 and 2023 Figure 6.9 Global Nano Satellite Market (by Defense End User), 2017-2023 Figure 6.10 Global Nano Satellite Market Analysis for Defense End User (by Application), $Thousand, 2017 and 2023 Figure 6.11 Global Nano Satellite Market (by Non-Profit Organization End User), 2017-2023 Figure 6.12 Global Nano Satellite Market Analysis for Non-Profit Organization End User (by Application), $Thousand, 2017 and 2023 Figure 7.1 Global Nano Satellite Market (by Mass), 2017 and 2023 Figure 7.2 Global 1kg-3kg Nano Satellite Market, 2017-2023 Figure 7.3 Global 1kg-3kg Nano Satellite Market (by Application), $Million, 2017 and 2023 Figure 7.4 Global 4kg-6kg Nano Satellite Market, 2017-2023 Figure 7.5 Global 4kg-6kg Nano Satellite Market (by Application), $Million, 2017 and 2023 Figure 7.6 Global 7kg-10kg Nano Satellite Market, 2017-2023 Figure 7.7 Global 7kg-10kg Nano Satellite Market (by Application), $Million, 2017 and 2023 Figure 8.1 Global Nano Satellite Market (by Subsystem), $Million, 2017-2023 Figure 8.2 Global Nano Satellite Market (by Payload Subsystem), $Million, 2017-2023 Figure 8.3 Global Nano Satellite Market (by Structure Subsystem), $Million, 2017-2023 Figure 8.4 Global Nano Satellite Market (by Telecommunication Subsystem), $Million, 2017- 2023 Figure 8.5 Global Nano Satellite Market (by On-Board Computer Subsystem), $Million, 2017- 2023 Figure 8.6 Global Nano Satellite Market (by Power System Subsystem), $Million, 2017-2023 81 82 84 87 91 93 94 95 96 97 98 99 100 101 102 103 105 106 107 108 109 110 111 114 115 117 118 119 120 14
Global Nano Satellite Market-Analysis and Forecast, 2018-2023 Figure 8.7 Global Nano Satellite Market (by Attitude Control Subsystem), $Million, 2017-2023 121 Figure 8.8 Global Nano Satellite Market (by Propulsion System Subsystem), $Million, 2017- 2023 Figure 9.1 Classification of Global Nano Satellite Market (by Region) Figure 9.2 Regional Distribution of Nano Satellite Market, 2017-2023 Figure 9.3 North America Nano Satellite Market, 2017-2023 Figure 9.4 North America Nano Satellite Market (by End User), $Million, 2017 and 2023 Figure 9.5 U.S. Nano Satellite Market Size, $Million, 2017-2023 Figure 9.6 Canada Nano Satellite Market Size, $Million, 2017-2023 Figure 9.7 Europe Nano Satellite Market, 2017-2023 Figure 9.8 Europe Nano Satellite Market (by End User), $Million, 2017 and 2023 Figure 9.9 U.K. Nano Satellite Market Size, $Million, 2017-2023 Figure 9.10 Germany Nano Satellite Market Size, $Million, 2017-2023 Figure 9.11 France Nano Satellite Market Size, $Million, 2017-2023 Figure 9.12 Russia Nano Satellite Market Size, $Million, 2017-2023 Figure 9.13 Denmark Nano Satellite Market Size, $Million, 2017-2023 Figure 9.14 Rest of Europe Nano Satellite Market Size, $Million, 2017-2023 Figure 9.15 Asia-Pacific Nano Satellite Market, 2017-2023 Figure 9.16 Asia-Pacific Nano Satellite Market (by End User), $Thousand Figure 9.17 China Nano Satellite Market Size, $Million, 2017-2023 Figure 9.18 India Nano Satellite Market Size, $Million, 2017-2023 Figure 9.19 Japan Nano Satellite Market Size, $Million, 2017-2023 Figure 9.20 South Korea Nano Satellite Market Size, $Million, 2017-2023 Figure 9.21 Rest-of-Asia-Pacific Nano Satellite Market Size, $Million, 2017-2023 Figure 9.22 Rest-of-the-World Nano Satellite Market, 2017-2023 Figure 9.23 Rest of the World Nano Satellite Market (by End User), $Thousand, 2017 and 2023 147 Figure 9.24 Middle East Nano Satellite Market Size, $Million, 2017-2023 Figure 9.25 Latin America Nano Satellite Market Size, $Thousand, 2018-2023 Figure 9.26 Africa Nano Satellite Market Size, $Million, 2017-2023 Figure 10.1 Share of Key Company Profiles Figure 10.2 Ball Corporation: Product Offerings Figure 10.3 Ball Corporation – Overall Financials, 2015-2017 Figure 10.4 Ball Corporation – Revenue by Business Segment, 2015-2017 Figure 10.5 Ball Corporation – Revenue by Geography, 2015-2017 Figure 10.6 Ball Corporation: SWOT Analysis 122 125 126 127 128 130 131 132 132 134 135 136 137 138 139 140 140 142 143 144 145 146 147 149 149 150 151 153 154 155 155 157 15
Global Nano Satellite Market-Analysis and Forecast, 2018-2023 Figure 10.7 Clyde Space Ltd.: Product Offerings Figure 10.8 Clyde Space Ltd.: SWOT Analysis Figure 10.9 GomSpace A/S: Product Offerings Figure 10.10 GomSpace A/S: Overall Financials, 2015-2017 Figure 10.11 GomSpace A/S: Share in Overall Revenue by Region, 2015-2017 Figure 10.12 GomSpace A/S: SWOT Analysis Figure 10.13 Innovative Solutions in Space BV: Product Offerings Figure 10.14 Innovative Solutions in Space BV: SWOT Analysis Figure 10.15 Israel Aerospace Industries Ltd.: Product Offerings Figure 10.16 Israel Aerospace Industries Ltd. – Overall Financials, 2015-2017 Figure 10.17 Israel Aerospace Industries Ltd. – Business Segment Revenue Mix, 2015-2017 Figure 10.18 Israel Aerospace Industries Ltd.: SWOT Analysis Figure 10.19 Lockheed Martin Corporation: Product Offerings Figure 10.20 Lockheed Martin Corporation – Overall Financials, 2015-2017 Figure 10.21 Lockheed Martin Corporation – Revenue by Business Segment, 2015-2017 Figure 10.22 Lockheed Martin Corporation – Revenue by Geography, 2015-2017 Figure 10.23 Lockheed Martin Corporation: SWOT Analysis Figure 10.24 NanoAvionika, LLC: Product Offerings Figure 10.25 NanoAvionika, LLC – SWOT Analysis Figure 10.26 Northrop Grumman Corporation: Product Offerings Figure 10.27 Northrop Grumman Corporation – Overall Financials, 2015-2017 Figure 10.28 Northrop Grumman Corporation – Revenue by Business Segment, 2015-2017 Figure 10.29 Northrop Grumman Corporation Revenue by Geography, 2015-2017 Figure 10.30 Northrop Grumman Corporation – SWOT Analysis Figure 10.31 OHB SE: Product Offerings Figure 10.32 OHB SE: Overall Financials, 2015-2017 Figure 10.33 OHB SE: Revenue by Business Segment, 2015-2017 Figure 10.34 OHB SE: Share in Overall Revenue by Region, 2015-2017 Figure 10.35 OHB SE: SWOT Analysis Figure 10.36 Planet Labs, Inc.: Product Offerings Figure 10.37 Planet Labs, Inc. – SWOT Analysis Figure 10.38 QinetiQ Group PLC: Product Offerings Figure 10.39 QinetiQ Group PLC – Overall Financials, 2016-2018 Figure 10.40 QinetiQ Group PLC – Revenue by Business Segment, 2016-2018 Figure 10.41 QinetiQ Group PLC – Share in Overall Revenue by Region, 2016-2018 159 160 162 163 163 165 167 168 170 171 172 173 175 176 177 177 179 181 182 184 185 185 186 187 189 190 190 191 192 194 195 197 198 198 199 16
Global Nano Satellite Market-Analysis and Forecast, 2018-2023 Figure 10.42 QinetiQ Group PLC – SWOT Analysis Figure 10.52 Sky and Space Global Ltd: SWOT Analysis Figure 10.43 Space Systems/Loral, LLC: Product Offerings Figure 10.44 Space Systems/Loral, LLC: SWOT Analysis Figure 10.45 The Boeing Company: Product Offerings Figure 10.46 The Boeing Company: Overall Financials, 2015-2017 Figure 10.47 The Boeing Company: Revenue by Business Segment, 2015-2017 Figure 10.48 The Boeing Company: Share in Overall Revenue by Region, 2015-2017 Figure 10.49 The Boeing Company: SWOT Analysis Figure 10.50 Tyvak Nano-Satellite Systems, Inc.: Product Offerings Figure 10.51 Tyvak Nano-Satellite Systems, Inc.: SWOT Analysis Figure 11.1 Global Nano Satellite Market Segmentation Figure 11.2 Secondary Data Sources Figure 11.3 Top Down and Bottom Up Approach Figure 11.4 Nano Satellite Market Influencing Factors Figure 11.5 Assumptions and Limitations 200 202 204 205 207 208 208 209 211 213 214 225 227 228 229 230 17
Global Nano Satellite Market-Analysis and Forecast, 2018-2023 18
Global Nano Satellite Market-Analysis and Forecast, 2018-2023 Disclaimer BIS Research provides valuable market intelligence to an exclusive group of customers in response to orders. The report is licensed only for the customer's internal use and is subject to restrictions set henceforth. This document and its contents are confidential and may not be further distributed, published, or reproduced, in whole or in part, by any medium or in any form for any purpose, without the expressed written consent of BIS Research. The customer will neither disclose the contents of the report, whether directly in any media or indirectly through the incorporation in a database, marketing list, report or otherwise; use or permit the use of information to generate any statistical or other information that is or will be provided to third parties; nor voluntarily produce the information in any legal proceedings. Market reports are based on the expectations, estimates, and projections, as of the date such information is available at. Recommendations, if any, contained in this report may or may not be suitable for all investors or businesses. The market conclusions drawn are necessarily based upon a number of estimates and assumptions that, while considered reasonable by BIS Research as of the date of such statements, are inherently subject to market fluctuations as well as business, economic, and competitive uncertainties and contingencies. For more details regarding permission, please contact us: Email: sales@bisresearch.com Tel: +1-510-404-8135 19