Download
1 / 19
190 likes | 208 Views
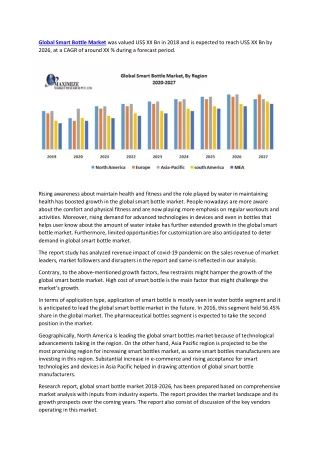
Smart nanomaterials market focus on type (Carbon-based, Metal-based, Polymeric), End-Use Industries. Smart nanomaterials market to grow at a significant CAGR of 33.32% on the basis of value during the forecast period from 2019 to 2029.<br>Read Report Overview: https://bisresearch.com/industry-report/smart-nanomaterials-market.html

E N D
Global Smart Nanomaterials Market Focus on Type (Carbon-based, Metal-based, Polymeric), End-Use Industries, and Country-Level Analysis – Analysis and Forecast, 2019-2029 March 2020 TOC
Global Smart Nanomaterials Market BIS Research is a leading market intelligence and technology research company. BIS Research publishes in-depth market intelligence reports focusing on the market estimations, technology analysis, emerging high-growth applications, deeply segmented granular country-level market data and other important market parameters useful in the strategic decision making for senior management. BIS Research provides multi-client reports, company profiles, databases, and custom research services. Copyright © 2020 BIS Research Inc. All Rights Reserved. This document contains highly confidential information and is the sole property of BIS Research. Disclosing, copying, circulating, quoting or otherwise reproducing any or all contents of this document is strictly prohibited. Access to this information is provided exclusively for the benefit of the people or organization concerned. It may not be accessed by, or offered whether for sale or otherwise to any third party. 2 All rights reserved at BIS Research
Global Smart Nanomaterials Market Preface Preface The rapid pace of advancements in the field of nanotechnology has led to advances in pharmaceutical industries, where further research is being carried out to enable further growth of more innovative material known as smart nanomaterials for various diseases diagnosis. Smart nanomaterials are promising materials due to their potential and promising range of applications in the medical and electronic fields. The smart nanomaterials are biomimetic with unique properties to be used in self- healing diagnostic and drug delivery. In recent years, smart nanomaterials are expected to be the material of choice to be used in various end-use industries and are expected to play a crucial role in the next-generation pharmaceutical technologies and devices. The market research study offers a wide perspective on smart nanomaterials and analyzes its influence on various end-users by providing critical insights into the direction of its future expansion. The market research study offers a wide perspective of the different types used by smart nanomaterials manufacturers. The report also provides an analysis of the market penetration of smart nanomaterials in different industries and their growth opportunities across different regions (as well as countries). The study focuses on the changing landscape of the smart nanomaterials market, owing to the significant developments made by the leading players. The research is based on extensive primary interviews (in-house experts, industry leaders, and market players) and secondary research (a host of paid and unpaid databases), along with the analytical tools that have been used to build the forecast and predictive models. This research has been conducted to answer some of the most crucial questions about the smart nanomaterials market: ▪ What are the major trends in the global smart nanomaterials market across different regions? ▪ Which type segment should a new company in the market focus on, to stay ahead of its competition? ▪ How do the existing market players function to improve their market positioning? ▪ How does the supply chain function in the global smart nanomaterials market? ▪ What are the major challenges inhibiting the growth of the global smart nanomaterials market? 3 All rights reserved at BIS Research
Global Smart Nanomaterials Market ▪ Which segment is expected to witness the maximum demand growth in the global smart nanomaterials market during 2019-2029? ▪ Which are the key end-use industries which experienced high demand in 2018, and which are the key industry areas which should be targeted by the manufacturers of different types of smart nanomaterials during the forecast period, 2019-2029? ▪ How should the strategies adopted by market players vary for different segments based on the size of companies involved in each segment? ▪ What are the key offerings of the prominent companies in the global smart nanomaterials market? Which regions and countries are leading in terms of consumption of smart nanomaterials, and which of them are expected to witness high demand growth from 2019 to 2029? ▪ What are the key consumption patterns of smart nanomaterials across different end-use industry in different regions and countries during the period 2019-2029? The report is a compilation of various segmentations, including market breakdown by type, application, and region. The report highlights the key driving and restraining forces for the market, as well as the opportunities associated with smart nanomaterials. In the extensive primary research process undertaken for this study, the sources include industry experts and key executives from prominent companies and organizations across the smart nanomaterials value chain. The trends of the smart nanomaterials market vary with different regions. The market holds a prominent share in various countries of North America, China, Europe, and Asia-Pacific (APAC). The report also provides a country-based analysis for all the leading countries in every region, including the U.S, Germany, and Japan, among others. Each regional analysis details an individual push-and-pull force, in addition to the key players and end-use industries in that particular region. BIS Advanced Materials and Chemicals March 2020 4 All rights reserved at BIS Research
Global Smart Nanomaterials Market Table of Contents Table of Contents Executive Summary ........................................................................................................ 19 1. Market Dynamics .................................................................................................. 26 Market Drivers ................................................................................................. 27 1.1.1 Rapid Pace of Advancements in the Field of Healthcare for Nanotechnology ................................................................................... 27 1.1.2 Increased Government Support and Funding for R&D ..................... 28 1.1.3 Growing Emphasis for Energy Storage .............................................. 29 1.2 Market Restraints ............................................................................................ 30 1.2.1 Problems with Toxicity and Environmental Effects of Smart Nanomaterials ....................................................................................... 30 1.2.2 Expensive Synthesis Technology Coupled with Lack of Skilled Professionals ........................................................................... 31 1.3 Market Opportunities ...................................................................................... 32 1.3.1 Opportunities for Smart Nanomaterials in the Aviation and Marine Industry ..................................................................................... 32 1.4 Market Challenges .......................................................................................... 32 1.4.1 Inability to Produce High-Quality Graphene on a Large Scale ......... 32 1.1 2. Competitive Landscape ....................................................................................... 34 2.1 Key Market Development and Strategies ...................................................... 34 2.1.1 Product Launches ................................................................................ 35 2.1.2 Contract and Agreements .................................................................... 36 2.1.3 Partnerships, Collaborations, and Joint Ventures ............................ 37 2.1.4 Others .................................................................................................... 38 3. Industry Analysis .................................................................................................. 39 3.1 3.2 Supply Chain Analysis.................................................................................... 39 Industry Attractiveness for Smart Nanomaterials Market ........................... 40 3.2.1 Threat of New Entrant .......................................................................... 41 3.2.2 Bargaining Power of Supplier ............................................................. 42 3.2.3 Bargaining Power of Buyer ................................................................. 43 3.2.4 Threat of Substitutes ............................................................................ 44 5 All rights reserved at BIS Research
Global Smart Nanomaterials Market Intensity of Competition ...................................................................... 44 Opportunity Matrix Analysis .......................................................................... 45 3.3.1 Opportunity Matrix Analysis (by Region) ........................................... 46 3.4 Technology Overview in Various End-Use Industries ................................. 46 3.4.1 Healthcare ............................................................................................. 47 3.4.2 Aerospace ............................................................................................. 47 3.2.5 3.3 4. Global Smart Nanomaterials Market (by Type), Analysis and Forecast (2019-2029) ............................................................................................................ 48 4.1 4.2 4.3 4.4 4.5 Market Overview .............................................................................................. 48 Carbon-Based .................................................................................................. 49 Metal-Based ..................................................................................................... 51 Polymeric ......................................................................................................... 53 Others............................................................................................................... 54 5. Global Smart Nanomaterials Market (by End-Use Industry), Analysis and Forecast (2019-2029) ..................................................................................... 56 5.1 5.2 5.3 5.4 5.5 5.6 5.7 Market Overview .............................................................................................. 56 Pharmaceuticals .............................................................................................. 58 Transportation ................................................................................................. 61 Electronics ....................................................................................................... 63 Construction .................................................................................................... 64 Environment .................................................................................................... 65 Others............................................................................................................... 66 6. Smart Nanomaterials Market (by Region), Analysis and Forecast (2019-2029) ............................................................................................................ 68 6.1 Market Overview .............................................................................................. 68 6.1.1 Global Smart Nanomaterials Market (by Region), $Million, 2018-2029 .............................................................................................. 69 6.2 Asia-Pacific ...................................................................................................... 70 6.2.1 Asia-Pacific Smart Nanomaterials Market (by Type) ......................... 71 6.2.2 Asia-Pacific Smart Nanomaterials Market (by End-Use Industry) ................................................................................................ 71 6.2.2.1 South Korea ........................................................................................... 72 6 All rights reserved at BIS Research
Global Smart Nanomaterials Market South Korea Smart Nanomaterials Market (by End-Use Industry) ............................................................................................ 73 Japan ...................................................................................................... 74 Japan Smart Nanomaterials Market (by End-Use Industry) .............. 74 India ........................................................................................................ 75 India Smart Nanomaterials Market (by End-Use Industry) ................ 76 Rest-of-Asia-Pacific ................................................................................ 76 Rest-of-Asia-Pacific Smart Nanomaterials Market (by End-Use Industry) ............................................................................................ 77 China ................................................................................................................ 77 6.3.1 China Smart Nanomaterials Market (by Type) ................................... 78 6.3.2 China Smart Nanomaterials Market (by End-Use Industry) .............. 78 6.4 North America ................................................................................................. 79 6.4.1 North America Smart Nanomaterials Market (by Type) ..................... 79 6.4.1.1 North America Smart Nanomaterials Market (by End-Use Industry) ...... 80 6.4.1.2 U.S. ........................................................................................................ 81 6.4.1.2.1 U.S. Smart Nanomaterials Market (by End-Use Industry) ................. 81 6.4.1.3 Canada ................................................................................................... 82 6.4.1.3.1 Canada Smart Nanomaterials Market (by End-Use Industry) ........... 82 6.4.1.4 Mexico .................................................................................................... 83 6.4.1.4.1 Mexico Smart Nanomaterials Market (by End-Use Industry)............. 83 6.5 Europe .............................................................................................................. 84 6.5.1 Europe Smart Nanomaterials Market (by Type) ................................. 85 6.5.1.1 Europe Smart Nanomaterials Market (by End-Use Industry) .................. 85 6.5.1.2 Germany ................................................................................................. 86 6.5.1.2.1 Germany Smart Nanomaterials Market (by End-Use Industry) ......... 87 6.5.1.3 France .................................................................................................... 87 6.5.1.3.1 France Smart Nanomaterials Market (by End-Use Industry) ............. 88 6.5.1.4 Russia .................................................................................................... 88 6.5.1.4.1 Russia Smart Nanomaterials Market (by End-Use Industry) ............. 89 6.5.1.5 Italy ......................................................................................................... 90 6.5.1.5.1 Italy Smart Nanomaterials Market (by End-Use Industry) ................. 90 6.5.1.6 Rest-of-Europe ....................................................................................... 91 6.2.2.1.1 6.2.2.2 6.2.2.2.1 6.2.2.3 6.2.2.3.1 6.2.2.4 6.2.2.4.1 6.3 7 All rights reserved at BIS Research
Global Smart Nanomaterials Market Rest-of-Europe Smart Nanomaterials Market (by End-Use Industry) ............................................................................................ 91 U.K. ................................................................................................................... 92 6.6.1 U.K. Smart Nanomaterials Market (by Type) ...................................... 92 6.6.2 U.K. Smart Nanomaterials Market (by End-Use Industry) ................. 93 6.7 Rest-of-the-World ............................................................................................ 93 6.7.1 Middle East and Africa ......................................................................... 93 6.7.1.1 Middle East & Africa Smart Nanomaterials Market (by End-Use Industry) ................................................................................................. 94 6.7.2 South America ...................................................................................... 94 6.7.2.1 South America Smart Nanomaterials Market (by End-Use Industry) ...... 95 6.5.1.6.1 6.6 7. Company Profiles ................................................................................................. 96 7.1 7.2 Overview .......................................................................................................... 96 Abbott............................................................................................................... 97 7.2.1 Company Overview .............................................................................. 97 7.2.2 Role of Abbott in the Smart Nanomaterials Market ........................... 97 7.2.3 Financials .............................................................................................. 98 7.2.4 Strengths of Abbott ............................................................................ 101 7.2.5 Weaknesses of Abbott ....................................................................... 101 7.3 ANP Co., LTD ................................................................................................. 102 7.3.1 Company Overview ............................................................................ 102 7.3.2 Role of ANP Co., LTD in the Smart Nanomaterials Market ............. 102 7.3.3 Strengths of ANP Co., LTD ................................................................ 103 7.3.4 Weaknesses of ANP Co., LTD ........................................................... 103 7.4 Akzo Nobel N.V. ............................................................................................. 104 7.4.1 Company Overview ............................................................................ 104 7.4.2 Role of Akzo Nobel N.V. in the Global Smart Nanomaterials Market .................................................................................................. 104 7.4.3 Financials ............................................................................................ 105 7.4.4 Strengths of Akzo Nobel N.V. ............................................................ 107 7.4.5 Weaknesses of Akzo Nobel N.V. ....................................................... 107 7.5 BASF SE......................................................................................................... 108 7.5.1 Company Overview ............................................................................ 108 8 All rights reserved at BIS Research
Global Smart Nanomaterials Market Role of BASF SE in the Global Smart Nanomaterials Market ......... 108 Financials ............................................................................................ 109 Strengths of BASF SE ........................................................................ 112 Weaknesses of BASF SE ................................................................... 112 Bayer AG ........................................................................................................ 113 7.6.1 Company Overview ............................................................................ 113 7.6.2 Role of Bayer AG in the Global Smart Nanomaterials Market ........ 113 7.6.3 Financials ............................................................................................ 114 7.6.4 Strengths of Bayer AG ....................................................................... 116 7.6.5 Weaknesses of Bayer AG .................................................................. 116 7.7 Clariant ........................................................................................................... 117 7.7.1 Company Overview ............................................................................ 117 7.7.2 Role of Clariant in the Global Smart Nanomaterials Market ........... 117 7.7.3 Financials ............................................................................................ 118 7.7.4 Strength of Clariant ............................................................................ 120 7.7.5 Weakness of Clariant ......................................................................... 120 7.8 Donaldson Company, Inc. ............................................................................ 121 7.8.1 Company Overview ............................................................................ 121 7.8.2 Role of Donaldson Company, Inc. in the Global Smart Nanomaterials Market ........................................................................ 121 7.8.3 Financials ............................................................................................ 123 7.9 JM Material Technology, Inc. ....................................................................... 126 7.9.1 Company Overview ............................................................................ 126 7.9.2 Role of JM Material Technology, Inc. in the Global Smart Nanomaterials Market ........................................................................ 126 7.9.3 Strength of JM Material Technology, Inc. ......................................... 127 7.9.4 Weaknesses of JM Material Technology, Inc. .................................. 127 7.10Nanologica ..................................................................................................... 128 7.10.1 Company Overview ............................................................................ 128 7.10.2 Role of Nanologica in the Global Smart Nanomaterials Market ..... 128 7.10.3 Strengths of Nanologica .................................................................... 129 7.10.4 Weaknesses of Nanologica ............................................................... 129 7.11Nanogate ........................................................................................................ 130 7.11.1 Company Overview ............................................................................ 130 7.5.2 7.5.3 7.5.4 7.5.5 7.6 9 All rights reserved at BIS Research
Global Smart Nanomaterials Market 7.11.2 7.11.3 7.11.4 7.12NanoBeauty ................................................................................................... 132 7.12.1 Company Overview ............................................................................ 132 7.12.2 Role of NanoBeauty in the Global Smart Nanomaterials Market .... 132 7.12.3 Strength of NanoBeauty .................................................................... 133 7.12.4 Weakness of NanoBeauty .................................................................. 133 7.13OPTINANOPRO ............................................................................................. 134 7.13.1 Company Overview ............................................................................ 134 7.13.2 Role of OPTINANOPRO in the Global Smart Nanomaterials Market .................................................................................................. 134 7.13.3 Strengths of OPTINANOPRO ............................................................. 135 7.13.4 Weaknesses of OPTINANOPRO ........................................................ 135 7.14The Nano Gard L.L.C..................................................................................... 136 7.14.1 Company Overview ............................................................................ 136 7.14.2 Role of The Nano Gard L.L.C. in the Global Smart Nanomaterials Market ........................................................................ 136 7.14.3 Strengths of The Nano Gard L.L.C. ................................................... 137 7.14.4 Weakness of The Nano Gard L.L.C. .................................................. 137 7.15Yosemite Technologies Co., Ltd .................................................................. 138 7.15.1 Company Overview ............................................................................ 138 7.15.2 Role of Yosemite Technologies Co., Ltd in the Global Smart Nanomaterials Market ........................................................................ 138 7.15.3 Strengths of Yosemite Technologies Co., Ltd ................................. 139 7.15.4 Weaknesses of Yosemite Technologies Co., Ltd ............................ 139 Role of Nanogate in the Global Smart Nanomaterials Market ........ 130 Strengths of Nanogate ....................................................................... 131 Weakness of Nanogate ...................................................................... 131 8. Report Scope and Methodology ........................................................................ 140 8.1 8.2 Report Scope ................................................................................................. 140 Global Smart Nanomaterials Market Research Methodology ................... 141 8.2.1 Assumptions ....................................................................................... 142 8.2.2 Limitations .......................................................................................... 142 8.2.3 Primary Data Sources ........................................................................ 142 8.2.4 Secondary Data Sources ................................................................... 144 10 All rights reserved at BIS Research
Global Smart Nanomaterials Market 8.2.5 8.2.6 Data Triangulation .............................................................................. 144 Market Estimation and Forecast ....................................................... 146 11 All rights reserved at BIS Research
Global Smart Nanomaterials Market List of Tables List of Tables Table 1.1: Impact Analysis of Drivers ..................................................................................................... 27 Table 1.2: Impact Analysis of Restraints ................................................................................................ 30 Table 2.1: Product Launches (2017-2019) ............................................................................................. 36 Table 2.2: Contracts and Agreements (2017-2019) ............................................................................... 37 Table 2.3: Partnerships, Collaborations, and Joint Ventures (2017-2019) ........................................... 37 Table 2.4: Key Other Activities (2017-2019)........................................................................................... 38 Table 3.1: Analyzing the Threat of New Entrants ................................................................................... 41 Table 3.2: Analyzing the Bargaining Power of Supplier ......................................................................... 42 Table 3.3: Analyzing the Bargaining Power of Buyer ............................................................................. 43 Table 3.4: Analyzing the Threat of Substitutes ....................................................................................... 44 Table 3.5: Analyzing the Intensity of Competition .................................................................................. 45 Table 4.1: Global Smart Nanomaterials Market (by Type), $Million, 2018-2029 .................................. 49 Table 4.2: Carbon Nanotubes Applications in Key End-use Industries ................................................. 50 Table 5.1: Smart Nanomaterials Applications in Key End-use Industries ............................................. 57 Table 5.2: Global Smart Nanomaterials Market (by End-Use Industry), $Million, 2018-2029 .............. 58 Table 5.3: Applications of Smart Nanomaterials in Pharmaceutical Industry ....................................... 60 Table 6.1: Global Smart Nanomaterials Market (by Region), $Million, 2018-2029 ............................... 69 Table 6.2: Asia-Pacific Smart Nanomaterials Market (by Type), $Million, 2018-2029 ......................... 71 Table 6.3: Asia-Pacific Smart Nanomaterials Market (by End-Use Industry), $Million, 2018-2029 ................................................................................................................................... 71 Table 6.4: South Korea Smart Nanomaterials Market (by End-Use Industry), $Million, 2018-2029 ................................................................................................................................... 73 Table 6.5: Japan Smart Nanomaterials Market (by End-Use Industry), $Million, 2018-2029 .............. 74 Table 6.6: India Smart Nanomaterials Market (by End-Use Industry), $Million, 2018-2029 ................ 76 Table 6.7: Rest-of-Asia-Pacific Smart Nanomaterials Market (by End-Use Industry), $Million, 2018-2029 ................................................................................................................................... 77 Table 6.8: China Smart Nanomaterials Market (by Type), $Million, 2018-2029 ................................... 78 Table 6.9: China Smart Nanomaterials Market (by End-Use Industry), $Million, 2018-2029 ............... 78 Table 6.10: North America Smart Nanomaterials Market (by Type), $Million, 2018-2029 ................... 79 Table 6.11: North America Smart Nanomaterials Market (by End-Use Industry), $Million, 2018-2029 ................................................................................................................................... 80 12 All rights reserved at BIS Research
Global Smart Nanomaterials Market Table 6.12: U.S. Smart Nanomaterials Market (by End-Use Industry), $Million, 2018-2029 ............... 81 Table 6.13: Canada Smart Nanomaterials Market (by End-Use Industry), $Million, 2018-2029 ......... 82 Table 6.14: Mexico Smart Nanomaterials Market (by End-Use Industry), $Million, 2018-2029........... 83 Table 6.15: Europe Smart Nanomaterials Market (by Type), $Million, 2018-2029 ............................... 85 Table 6.16: Europe Smart Nanomaterials Market (by End-Use Industry), $Million, 2018-2029 .......... 85 Table 6.17: Germany Smart Nanomaterials Market (by End-Use Industry), $Million, 2018-2029 ................................................................................................................................... 87 Table 6.18: France Smart Nanomaterials Market (by End-Use Industry), $Million, 2018-2029 ........... 88 Table 6.19: Russia Smart Nanomaterials Market (by End-Use Industry), $Million, 2018-2029 ........... 89 Table 6.20: Italy Smart Nanomaterials Market (by End-Use Industry), $Million, 2018-2029 ................ 90 Table 6.21: Rest-of-Europe Smart Nanomaterials Market (by End-Use Industry), $Million, 2018-2029 ................................................................................................................................... 91 Table 6.22: U.K. Smart Nanomaterials Market (by Type), $Million, 2018-2029 ................................... 92 Table 6.23: U.K. Smart Nanomaterials Market (by End-Use Industry), $Million, 2018-2029 ............... 93 Table 6.24: Middle East & Africa Smart Nanomaterials Market (by End-Use Industry), $Million, 2018-2029 ................................................................................................................................... 94 Table 6.25: South America Smart Nanomaterials Market (by End-Use Industry), $Million, 2018-2029 ................................................................................................................................... 95 13 All rights reserved at BIS Research
Global Smart Nanomaterials Market List of Figures List of Figures Figure 1: Global Smart Nanomaterials Market Overview, 2018-2029 ................................................... 21 Figure 2: Global Smart Nanomaterials Market (by Type), 2018, 2019, and 2029 ................................ 22 Figure 3: Global Smart Nanomaterials Market Analysis (by End-Use Industry) ................................... 23 Figure 4: Global Smart Nanomaterials Market (by Region), 2018 ........................................................ 24 Figure 1.1: Market Dynamics: Global Smart Nanomaterials Market ..................................................... 26 Figure 2.1: Share of Key Market Strategies and Developments, 2017-2020 (Feb) .............................. 35 Figure 3.1: Global Smart Nanomaterials Market Supply Chain ............................................................. 39 Figure 3.2: Porter’s Five Forces Analysis of Smart Nanomaterials Market........................................... 40 Figure 3.3: Global Smart Nanomaterials Market Opportunity Matrix (by Region), 2019-2029 ............. 46 Figure 4.1: Types of Smart Nanomaterials ............................................................................................. 48 Figure 4.2: Carbon-based in Global Smart Nanomaterials Market (by Type), $Million, 2018-2029 ................................................................................................................................... 51 Figure 4.3: Metal-Based in Global Smart Nanomaterials Market (by Type), $Million, 2018-2029 ....... 52 Figure 4.4: Polymeric in Global Smart Nanomaterials Market (by Type), $Million, 2018-2029 ............ 54 Figure 4.5: Others in Global Smart Nanomaterials Market (by Type), $Million, 2018-2029 ................. 55 Figure 5.1: Global Smart Nanomaterials - End-Use Industry Segmentation ........................................ 56 Figure 5.2: Pharmaceutical Industry in Global Smart Nanomaterials Market (by End-Use Industry), $Million, 2018-2029 .................................................................................................... 60 Figure 5.3: Transportation Industry in Global Smart Nanomaterials Market (by End-Use Industry), $Million, 2018-2029 .................................................................................................... 62 Figure 5.4: Electronics Industry in the Global Smart Nanomaterials Market (by End-Use Industry), $Million, 2018-2029 .................................................................................................... 63 Figure 5.5: Construction Industry in the Global Smart Nanomaterials Market (by End-Use Industry), $Million, 2018-2029 .................................................................................................... 64 Figure 5.6: Environmental Industry in Global Smart Nanomaterials Market (by End-Use Industry), $Million, 2018-2029 .................................................................................................... 66 Figure 5.7: Others Industry in the Global Smart Nanomaterials Market (by End-Use Industry), $Million, 2018-2029 ..................................................................................................................... 67 Figure 6.1: Global Smart Nanomaterials Market – Regional Segmentation ......................................... 68 Figure 6.2: Global Smart Nanomaterials Market (by Region), $Million, 2018 and 2029 ...................... 69 Figure 7.1: Abbott: Product Portfolio ....................................................................................................... 98 14 All rights reserved at BIS Research
Global Smart Nanomaterials Market Figure 7.2: Abbott: Overall Financials, 2016-2018 ................................................................................. 99 Figure 7.3: Abbott: Net Revenue (by Region), 2016-2018 .................................................................. 100 Figure 7.4: Abbott: Net Revenue (by Business Segment), 2016-2018 ............................................... 100 Figure 7.5: ANP Co., LTD: Product Portfolio ........................................................................................ 102 Figure 7.6: Akzo Nobel N.V.: Product Portfolio .................................................................................... 104 Figure 7.7: Akzo Nobel N.V.: Overall Financials, 2016-2018 .............................................................. 105 Figure 7.8: Akzo Nobel N.V.: Net Revenue (by Region), 2016-2018 .................................................. 106 Figure 7.9: Akzo Nobel N.V.: Net Revenue (by Business Segment), 2016-2018 ............................... 106 Figure 7.10: BASF SE: Product Portfolio .............................................................................................. 109 Figure 7.11: BASF SE: Overall Financials, 2016-2018 ........................................................................ 110 Figure 7.12: BASF SE: Net Revenue (by Region), 2016-2018 ........................................................... 110 Figure 7.13: BASF SE: Net Revenue (by Business Segment), 2016-2018 ........................................ 111 Figure 7.14: Bayer AG: Product Portfolio ............................................................................................. 114 Figure 7.15: Bayer AG: Overall Financials, 2016-2018 ....................................................................... 115 Figure 7.16: Bayer AG: Net Revenue (by Region), 2016-2018 ........................................................... 115 Figure 7.17: Bayer AG: Net Revenue (by Business Segment), 2016-2018 ........................................ 116 Figure 7.18: Clariant: Product Portfolio ................................................................................................. 117 Figure 7.19: Clariant: Overall Financials, 2016-2018 ........................................................................... 118 Figure 7.20: Clariant: Net Revenue (by Region), 2016-2018 .............................................................. 119 Figure 7.21: Clariant: Net Revenue (by Business Segment), 2016-2018 ........................................... 119 Figure 7.22: Donaldson Company, Inc.: Product Portfolio ................................................................... 122 Figure 7.23: Donaldson Company, Inc.: Overall Financials, 2017-2019 ............................................. 123 Figure 7.24: Donaldson Company, Inc.: Net Revenue (by Region), 2017-2019 ................................ 124 Figure 7.25: Donaldson Company, Inc.: Net Revenue (by Business Segment), 2017-2019 ............. 124 Figure 7.26: JM Material Technology, Inc.: Product Portfolio .............................................................. 127 Figure 7.27: Nanologica: Product Portfolio ........................................................................................... 128 Figure 7.28: Nanogate: Product Portfolio ............................................................................................. 130 Figure 7.29: NanoBeauty: Product Portfolio ......................................................................................... 132 Figure 7.30: OPTINANOPRO: Product Portfolio .................................................................................. 134 Figure 7.31: The Nano Gard L.L.C.: Product Portfolio ......................................................................... 137 Figure 7.32: Yosemite Technologies Co., Ltd: Product Portfolio ......................................................... 138 Figure 8.1: Global Smart Nanomaterials Market Coverage ................................................................. 140 Figure 8.2: Segmentations for Market Estimation in the Global Smart Nanomaterials Market .......... 141 15 All rights reserved at BIS Research
Global Smart Nanomaterials Market Figure 8.3: Report Design ..................................................................................................................... 141 Figure 8.4: Primary Interviews (by Player, Designation, and Region) ................................................. 143 Figure 8.5: Data Triangulation............................................................................................................... 145 Figure 8.6: Top-Down and Bottom-Up Approach ................................................................................. 146 16 All rights reserved at BIS Research
Global Smart Nanomaterials Market BIS Research Offerings: BIS Research Offerings: We are on a mission to harness the potential of disruptive technologies to make businesses thrive in today’s digital age. We have a vision to be a leading and a preferred knowledge partner for corporates and institutions worldwide and assist them with market intelligence in the area of emerging technologies, advisories, and other innovative solutions. Know More Know More Know More Know More 17 All rights reserved at BIS Research
Global Smart Nanomaterials Market Disclaimer Disclaimer BIS Research Inc. provides valuable market intelligence to an exclusive group of customers in response to orders. The report is licensed for the customer's internal use only and is subject to restrictions set henceforth. This document and its contents are confidential and may not be further distributed, published or reproduced, in whole or in part, by any medium or in any form for any purpose, without the written consent of BIS Research. The customer will not disclose the contents of the report, whether directly through any medium or indirectly through incorporation in a database, marketing list, report or otherwise, or use or permit the use of information to generate any statistical or other information that is or will be provided to third parties, or voluntarily produce information in legal proceedings. Market reports are based on expectations, estimates and projections as of the date such information is available. Any recommendation contained in this report may not be suitable for all investors or businesses. The market conclusions drawn are necessarily based upon a number of estimates and assumptions that, while considered reasonable by BIS Research as of the date of such statements, are inherently subject to market fluctuations and business, economic and competitive uncertainties and contingencies For more details regarding permission, please contact us: Email: sales@bisresearch.com Tel: +1 510 404 8135 18 All rights reserved at BIS Research
Global Smart Nanomaterials Market BIS RESEARCH INC. BIS RESEARCH INC. 39111 Paseo Padre PKWY, Suite 313 Fremont, CA 94538 -1686 39111 Paseo Padre PKWY, Suite 313 Fremont, CA 94538 -1686 E-mail: info@bisresearch.com | Call Us: +1-510-404-8135 E-mail: info@bisresearch.com | Call Us: +1-510-404-8135 Global Delivery Center Global Delivery Center Tower B First Floor, Tapasya Corporate Heights, Greater Noida Expressway, Tower B First Floor, Tapasya Corporate Heights, Greater Noida Expressway, Sector 126, Noida, U.P., 201303, India Sector 126, Noida, U.P., 201303, India Tel: +91 120 4261540 / 4261544 Tel: +91 120 4261540 / 4261544 19 All rights reserved at BIS Research www.bisresearch.com