Download
1 / 13
130 likes | 147 Views
This study presents the UVIS instrument measurements of hydrogen exospheres at the icy Saturnian satellites. The observations focus on Ly-α background and off-limb signals, as well as the potential sources of hydrogen. Preliminary results suggest that sputtering is the dominant source of hydrogen.

E N D
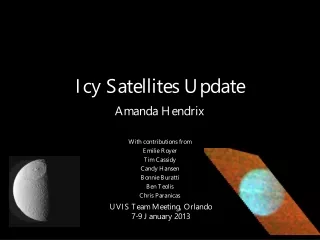
Cassini UVIS Measurements of Hydrogen Exospheres at the Icy Saturnian Satellites Amanda Hendrix Candy Hansen (with input from Charles Barth, Wayne Pryor, Don Shemansky) JPL/CalTech DPS 2005
The UVIS Instrument • Long slit - 64 spatial pixels • Each spatial pixel is 1 mrad x (0.75, 1.5, 8) mrad • 1024 spectral pixels per spatial pixel • Images are made by scanning • Here we focus on observations when slit is held steady for ~10 min (increased SNR)
Hydrogen measurements - 1 • Ly- (1216 Å) • Ly- (1025 Å) not discussed here • Disk itself is darker than background at 1216 Å • due to presence of H2O ice, which is very dark at short wavelengths • Signal off limb of icy satellite is higher than surrounding background Ly- • Background Ly- is combination of IPH + Saturn system H Icy satellites contribute in part to Saturn system H cloud
Hydrogen measurements - 2 • The Ly- background does not vary significantly over the measured angular distance • Distribution is not due to sensitivity variations along slit • Off-axis scattering from body does not contribute to off-limb signal at Ly- • Results are preliminary • Still being worked • Background levels are still being studied
Mimas Night/LH Day/TH Larger pixels Range= 84,000-67,769 km Lon= 218°W Phase= 42.7° 012MI_ICYLON072_VIMS 18.7° between MI & SA
Mimas Night/LH Day/TH column emission rate = 0.051 kR slant column density= 2.52576e+12 atoms/cm2 volume density= 64432.7 atoms/cm3 escape flux = 2.2e+09 atoms/cm2-sec column emission rate = 0.057 kR slant column density= 2.80360e+12 atoms/cm2 volume density= 71520.3 atoms/cm3 escape flux = 2.4e+09 atoms/cm2-sec
Enceladus Day/TH Night/LH column emission rate = 0.0328 kR slant column density= 1.62376e+12 atoms/cm2 volume density= 32475.2 atoms/cm3 escape flux = 1.06e+09 atoms/cm2-sec column emission rate = 0.0396 kR slant column density= 1.96040e+12 atoms/cm2 volume density= 39207.9 atoms/cm3 escape flux = 1.3e+09 atoms/cm2-sec
Tethys Night/LH Day/TH column emission rate = 0.0232 kR slant column density= 1.14889e+12 atoms/sec volume density= 10838.6 atoms/cm3 escape flux = 3.6e+08 atoms/cm2-sec column emission rate = 0.0222 kR slant column density= 1.10219e+12 atoms/sec volume density= 10398.0 atoms/cm3 escape flux = 3.5e+08 atoms/cm2-sec
Dione Night/Sub-Sat Day/Anti-Sat column emission rate = 0.0267 kR slant column density= 1.32603e+12 atoms/cm2 volume density= 11839.5 atoms/cm3 escape flux = 3.97e+08 atoms/cm2-sec column emission rate = 0.0179 kR slant column density= 8.84017e+11 atoms/cm2 volume density= 7893.01 atoms/cm3 escape flux = 2.6e+08 atoms/cm2-sec
Rhea Night/LH Day/TH column emission rate = 0.0411111 kR slant column density= 2.03520e+12 atoms/cm2 volume density= 13302.0 atoms/cm3 escape flux = 4.5e+08 atoms/cm2-sec column emission rate = 0.034 kR slant column density= 1.68899e+12 atoms/cm2 volume density= 11039.2 atoms/cm3 escape flux = 3.7e+08 atoms/cm2-sec
Possible Sources of H • Sputtering of H2O ice by ions • H2O + H+ (O+) -> H2O vapor, H, H2 • Fraction of sputtered particles that are H atoms? • Photodesorption of H2O ice • H2O + h -> H2O vapor, H, H2 • Westley et al. (1995) measure yields of ~0.5% (85K) - 0.7% (100K) • Photodesorption experiments studying H are lacking • Our measurements require yields of at least ~0.7% • This may be an unimportant source relative to sputtering • Photodissociation of H2O vapor • From sputtering, sublimation or photodesorption • H2O + h -> H + OH • Too cold for sublimation (T<110K) • E-ring particle bombardment • Micrometeoroid bombardment
Measured vs. Predicteda FluxesaJurac et al. (2001) H2O mol/cm2-sec for O+ ions PredictedUVIS-Measuredatoms/s Mimas 1.59e9 2+.5 e9 9.6e24 Enceladus 7.5e8 1+.5e95.9e24 Tethys 6.6-7.6e8 3.5+.5e81.2e25 Dione 3.9-6.5e8 <1e83.9e24 Rhea ----- 4+.5e8 2.9e25 Measured fluxes are generally consistent with predicted -- good indicator that sputtering is dominant source -- may suggest additional source is secondarily important
Conclusions • Clear Ly- signal above background • Escape fluxes are consistent with predicted sputtering rates • No significant leading-trailing variations so far • Suggests that gyroradii of scattering particles are as large as the body