Download
1 / 16
160 likes | 301 Views
An Outbreak Detection Algorithm that Efficiently Performs Complete Bayesian Model Averaging Over All Possible Spatial Distributions of Disease. Yanna Shen 1,2 , Weng-Keen Wong 3 , John D. Levander 2 and Gregory F. Cooper 1,2

E N D
An Outbreak Detection Algorithm that Efficiently Performs Complete Bayesian Model Averaging Over All Possible Spatial Distributions of Disease Yanna Shen1,2, Weng-Keen Wong3, John D. Levander2 and Gregory F. Cooper1,2 1Intelligent Systems Program and 2Department of Biomedical Informatics, University of Pittsburgh; 3School of Electrical Engineering and Computer Science, Oregon State University
Introduction • Bayesian outbreak detection algorithm • Monitors for a wide variety of spatial distributions of a disease outbreak • Performs complete Bayesian model averaging over all spatial distributions of disease in polynomial time (relative to some finite set of spatial primitives, such as zip codes)
Background • Most commonly used approaches to spatial outbreak detection • Are frequentist (e.g., spatial scan algorithms) • Detect outbreaks by finding the singlecontiguous subregion where the outbreak is the most likely to be occurring • The Spatial Bayesian Model Averaging (SBMA) algorithm introduced here • Is Bayesian • Detects outbreaks by considering all possiblecontiguous and non-contiguous subregions where the outbreak may be occurring
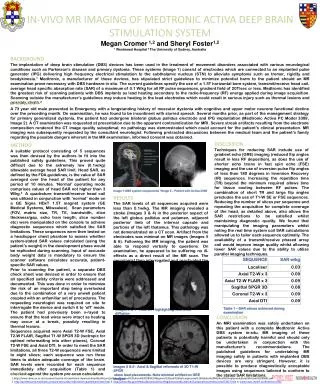
An example of outbreak states in a hypothetical region 1 2 3 • Three zip codes in a hypothetical region monitored • OBi and NOBi: represent the disease outbreak states (outbreak and non-outbreak) for zip code i. where 1 ≤ i ≤ 3. • Total number of spatial outbreak states in the region: 23 = 8 OBi NOBi
General case of outbreak states in a hypothetical region • Suppose that there are r zip codes in a region being monitored. Then there are 2r spatial outbreak states. • Consider each outbreak state as being a spatial disease hypothesis • If we perform complete Bayesian model averaging over all of these hypotheses in a brute-force way, then the time complexity is O(2r )
Notation • r – total number of zip codes in a hypothetical region • i – the index of a specific zip code, where 1 ≤ i ≤ r • q – the probability that a zip code has an outbreak. • P(q): our belief about q When 0 < q ≤ 1, we model that P(q) = 1 – α, where 0 ≤ α ≤ 1.
Definitions • OB: the state that at least one zip code has an outbreak present • NOB: the state that no zip code has a disease outbreak, where P(NOB) = α
Assumptions • The spatial region is partitioned into a finite set of spatial primitives, such as r zip codes. • A spatial outbreak hypothesis consists of an assignment of an outbreak as present or absent to each spatial primitive. • Each spatial primitive is modeled as an independent Bernoulli trial with probability q of having an outbreak during the current period. • Data consists of the current period counts of some binary event (e.g., ED respiratory counts in the past 24 hours).
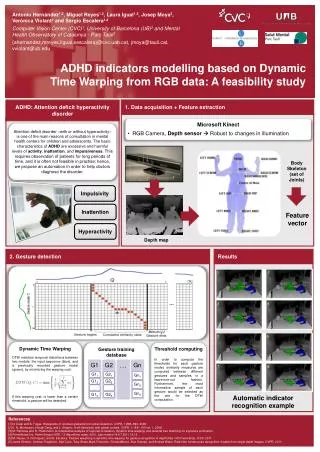
The SBMA algorithm • The joint probability of the data (D) and the outbreak state (OB): Linear time Polynomial time P(D1, NOB1|q) + P(D1, OB1|q) 1 2 3 P(D3, NOB3|q) P(D2, NOB2|q) + P(D3, OB3|q) + P(D2, OB2|q)
The SBMA algorithm Polynomial time where Di represents the data for zip code i . Linear time • Computes the posterior probability P(OB|D) Polynomial time *http://www.dbmi.pitt.edu/panda/papers/Shen/ISDS07.pdf
Preliminary experiments • 96 simulated anthrax outbreaks* • Each outbreak consists of a time series of ED patient cases, where each case has a chief complaint and a zip code. • The probability that a case was assigned to live in a zip code was proportional to the population of that zip code. • The simulated outbreak cases were overlaid onto real ED cases to create a semi-synthetic dataset of a scattered disease distribution. • Ran PANDA* and SBMA on each of the 96 semi-synthetic datasets * Cooper GF, Dash DH, Levander, JD, Wong WK, Hogan WR, Wagner MM. Bayesian biosurveillance of disease outbreaks. In: Proceedings of the Conference on Uncertainty in Artificial Intelligence (2004) 94-104 [We used the version of PANDA reported in Figure 7].
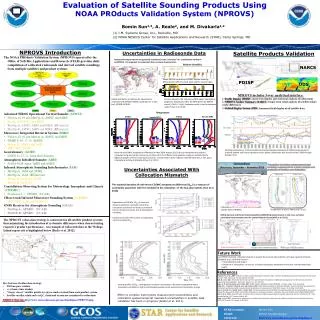
Preliminary results • AMOC curves for PANDA and SBMA when the prior probability of an outbreak was 10%. • At 0 false positive: SBMA detected the simulated scattered-disease outbreaks on average about 12 hours before PANDA
Preliminary results • We also ran PANDA and SBMA on 96 semi-synthetic datasets of simulated outbreaks due to outdoor aerosol releases of anthrax spores • At 0 false positives PANDA detected a simulated anthrax outbreak on average about 5 hours before SBMA
Conclusions • An algorithm called SBMA was introduced that performs exhaustive Bayesian model averaging over all possible spatial distributions of disease. • SBMA monitors for a wide variety of spatial patterns of a disease outbreak in polynomial time. • Preliminary results support that SBMA is complementary to PANDA in disease outbreak detection.
Future work • Apply the SBMA algorithm to a wide variety of semi-synthetic outbreak test scenarios and compare its detection performance to that of other spatial algorithms • Develop a multivariate version of SBMA • Extend SBMA to model progression of disease over time in order to create a spatio-temporal BMA outbreak-detection algorithm
Acknowledgements • This research was funded by a grant from the National Science Foundation (NSF IIS-0325581)