Download
1 / 4
50 likes | 241 Views
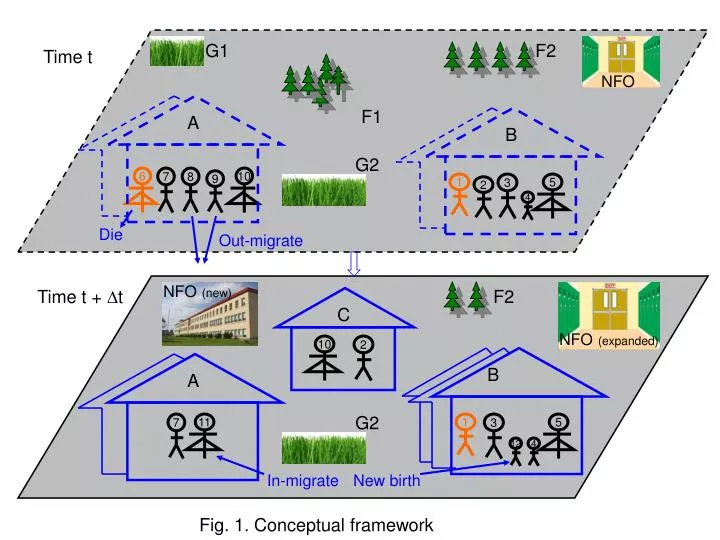
1. 1. 3. 8. 7. 2. 7. 3. 5. 11. 10. 5. 2. 9. 6. 10. 4. 4. 12. C. G1. F2. Time t. NFO. F1. A. B. G2. Die. Out-migrate. NFO (new). Time t + t. F2. NFO (expanded). B. A. G2. In-migrate. New birth. Fig. 1. Conceptual framework. Person i. Check CVFS data.

E N D
1 1 3 8 7 2 7 3 5 11 10 5 2 9 6 10 4 4 12 C G1 F2 Time t NFO F1 A B G2 Die Out-migrate NFO(new) Time t + t F2 NFO(expanded) B A G2 In-migrate New birth Fig. 1. Conceptual framework
Person i Check CVFS data Check GIS land use & vegetation maps No Special conflict or crisis? Yes Calculate: prop of Forest and grass (xe) dist to nearest forest (xf) dist to nearest NFO (xNFO) Check Time for fuelwood collection (xfd) Rice productivity (xag) Value of xo Calculate p2 = f (conflict, crisis) i = i +1 (move to next person) Generate random number RN p = p1or p2 Calculate p1 = b0+b1xe+b2xf+ b3xNFO+b4xfd+b5xag+b6xo Yes No RN < P? Outmigrate Remain Fig. 2. Determine the outmigration probability
Household i (i = 1, …, n) Start Stop Check self-reported site(s) Collect and return Yes Expand checking area Closest to Home location? No Have other potential sites? No Yes Have fuelwood? No Fig. 3. Choosing fuelwood collection site
Low-moderate Flooding + + Environmental degradation Perceived env. degradation + + + Outmigration Infertility - - - Population size % of vegetated land Fig. 4. Multiple relationships related to flooding