Download
1 / 57
570 likes | 739 Views
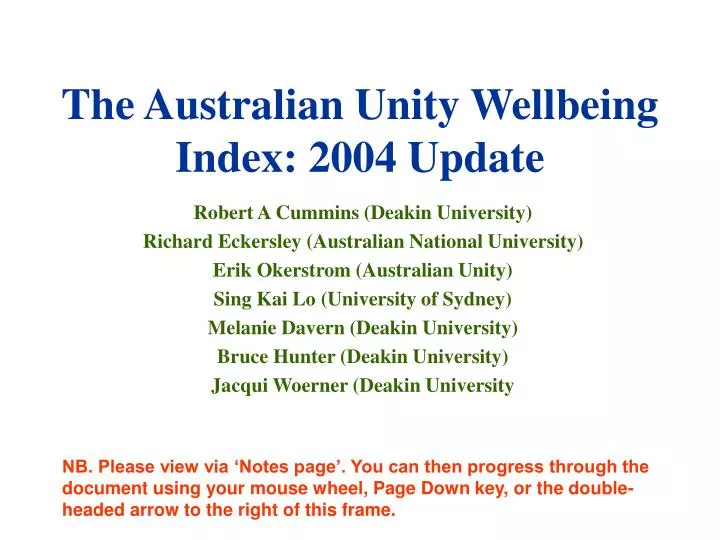
The Australian Unity Wellbeing Index: 2004 Update. Robert A Cummins (Deakin University) Richard Eckersley (Australian National University) Erik Okerstrom (Australian Unity) Sing Kai Lo (University of Sydney) Melanie Davern (Deakin University) Bruce Hunter (Deakin University)

E N D
The Australian Unity Wellbeing Index: 2004 Update Robert A Cummins (Deakin University) Richard Eckersley (Australian National University) Erik Okerstrom (Australian Unity) Sing Kai Lo (University of Sydney) Melanie Davern (Deakin University) Bruce Hunter (Deakin University) Jacqui Woerner (Deakin University NB. Please view via ‘Notes page’. You can then progress through the document using your mouse wheel, Page Down key, or the double-headed arrow to the right of this frame.
Quality of Life Objective Conditions e.g. Medical Health Subjective Perceptions e.g. Satisfaction with health Objective vs subjective: r = N.S.
What is Subjective Wellbeing? A positive state of mind that involves the whole life experience
“How satisfied are you with your life as a whole?” • Standard of living • Health • Achieving • Relationships • Safety • Community connectedness • Future security Life Domains
How satisfied are you with your ----? [Jones and Thurstone ,1955] 11-point, end-defined scale Completely Dissatisfied Completely Satisfied Mixed
‘Percentage of Scale Maximum’ %SM Converts Likert scale data to a standardized range from 0 - 100 Original values Standardized values
Gold Standard for Subjective Wellbeing 75 ± 2.5%SM Range: 70–80%SM
The Australian Unity Wellbeing Index • A new systematic measure of subjective wellbeing • An alternative to objective indicators – eg. GDP
The Australian Surveys Geographically representative sample N = 2,000 Telephone interview #1: April 2001 #2: September 2001 (immediately following September 11) ------------ #12: August 2004
So, what has been happening to the subjective wellbeing of Australians over the past 3.5 years?
Wellbeing in Australia Strength of satisfaction Major Events Preceding Survey Survey Date
Strength of satisfaction Major Events Preceding Survey September 11 Bali Bombing Survey Date
>S2, S4, S5 Strength of satisfaction Scores above this line are significantly higher than S1 Major Events Preceding Survey September 11 Bali Survey Date
Standard of living • Health • Productivity • Relationships • Safety • Community connectedness • Future security Satisfaction with---- Personal Wellbeing Index
>S2, S4, S5 Strength of satisfaction Scores above this line are significantly higher than S1 Major Events Preceding Survey September 11 Bali Pre- Post- Iraq Iraq Survey Date
>S2, S4, S5 Strength of satisfaction Scores above this line are significantly higher than S1 Major Events Preceding Survey September 11 Bali Pre- Post- Iraq Iraq Survey Date
>S2, S4, S5 Strength of satisfaction Scores above this line are significantly higher than S1 Major Events Preceding Survey September 11 Bali Pre- Post- Olympics Iraq Iraq Survey Date
>S11 >S2, S4, S5 Strength of satisfaction Scores above this line are significantly higher than S1 Major Events Preceding Survey September 11 Bali Pre- Post- Olympics Iraq Iraq Survey Date
How is subjective wellbeing held so constant? Subjective wellbeing Homeostasis
Subjective Wellbeing Homeostasis • Like the internal management of body temperature and blood pressure • Our sense of satisfaction with our lives is also internally managed and held constant
Homeostasis can be defeated by: • Chronic pain (arthritis) • Chronic stress (carers) • Lack of intimacy • Living conditions (street-kids) • Incarceration (prisoners) • Poverty
High SWB ? Low Very Weak Very Strong Stress The Relationship Between Stress and SWB
DISTRESS High Threshold Low The Relationship Between Stress and SWB Dominant Source of SWB Control Homeostasis 75 SWB No stress High stress Stress Level of environmental challenge
Principle 1 • Subjective wellbeing is managed by a homeostatic system. This why its measurement is so reliable. • Therefore, there will be a non-linear relationship between any source of stress (ill health or physical incapacity) with how people feel about the overall quality of their life
85 82.0 81.3 80 79.0 75.4 75.3 76.5 Normative Range Strength 75 of 73.3 74.5 73.2 74.2 72.4 74.1 70 (PWI) 69.2 65 60 0 1 2 3 4 5 6 7 8 9 10 Degree of stress Degree of Stress: PWI satisfaction
Underweight Normal Overweight Obese Mild Moderate Severe Body Mass Index Body Mass Index
Principle 2 • It CAN NOT be assumed that people who have a chronic medical condition have low subjective wellbeing • Even self-reported medical symptoms are extremely poor indicators of how people feel about their lives generally
Homeostatic control is all about the balance between the degree of challenge and the level of personal resources Examples of External Resources Money Relationships
Significant Increments in PWI Household Income
The cost of purchasing a percentage point of personal wellbeing 1,250,000 1,250,000 200,000
The Relative Influence of Household Income on the Personal Domains
Income x Age (combined data) Age Specific- Normative range
Income x Age (combined data) Age Specific- Normative range
Income x Age (combined data) Age Specific- Normative range
Income x Age (combined data) Age Specific- Normative range
Income x Age x Gender (combined data) Age Specific- Normative range Age
Income x Household Structure: Personal Wellbeing Index (combined Surveys 9-12)
Income x Household Structure: Personal Wellbeing Index (combined Surveys 9-12)
Income x Household Structure: Personal Wellbeing Index (combined Surveys 9-12)
Income x Household Structure: Personal Wellbeing Index (combined Surveys 9-12)
Income x Household Structure: Personal Wellbeing Index (combined Surveys 9-12)