Download
1 / 17
180 likes | 340 Views
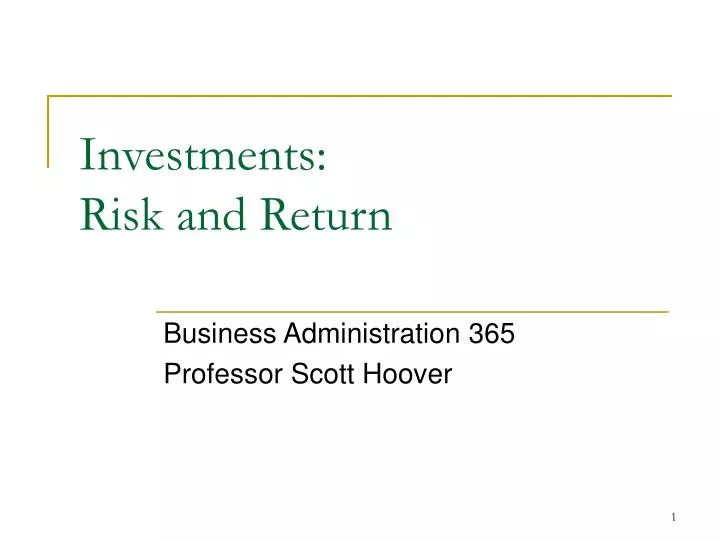
Investments: Risk and Return. Business Administration 365 Professor Scott Hoover. Returns Return measure of the benefit received from an investment holding period return % change in value over the period effective annual return (EAR) 1-year holding period return

E N D
Investments:Risk and Return Business Administration 365 Professor Scott Hoover
Returns • Return measure of the benefit received from an investment • holding period return % change in value over the period • effective annual return (EAR) 1-year holding period return • includes the effects of compounding. • annual percentage rate (APR) per period rate × # of periods per year • ignores the effects of compounding
If rp is the per period rate and m is the # of compounding periods per year, • Putting those together gives • The distinction is important because… • Annual discount rates must be EARs • Banks quote APRs • Bond yield-to-maturities (YTMs) are APRs • Credit cards and option valuation models use continuously-compounded interest rates • APRs with m = ∞
A few examples… • A bank quotes 9% APR, compounded monthly. • Per period rate 9%/12 = 0.75% • EAR = 1.007512 - 1 = 9.38% • A bond pays 4% interest every six months. • YTM = 4%×2 = 8% • EAR = 1.042 - 1 = 8.16% • The continuously-compounded interest rate is 6% per year. • What happens as m gets bigger? • m = 10 → EAR = 6.165% • m = 100 → EAR = 6.182% • m = 1000 → EAR = 6.183% • m = ∞ → EAR = 6.184%
Risk • Risk measure of the potential for loss in an investment • How should we measure risk? • Reality: we really don’t know how to best measure risk. • What do we know about risk? • Some risk is all but eliminated in well-diversified portfolios • diversifiable risk (aka, idiosyncratic risk, firm-specific risk) • Some risk remains no matter how well-diversified we are • non-diversifiable risk (aka, systematic risk, market risk)
Capital Asset Pricing Model (CAPM) • Intuition: Investors will only be compensated for the level of non-diversifiable risk they take on. Why? • Definition: market portfolio≡ portfolio of all assets weighted according to their market values. • Result • Expected return on a well-diversified portfolio is a linear function of the standard deviation of the portfolio’s returns • Why is std. dev. a reasonable measure here? • The line is called the Capital Market Line (CML) • E(R) = Rf + (/ m)(E(Rm)-Rf) • R return on portfolio • Rm return on market portfolio • Rf risk-free return • std. dev. of portfolio • m std. dev. of market portfolio
Expected Return Capital Market Line E(Rm) Rf sm Risk (standard deviation)
The CML is useful for well-diversified portfolios, but not for individual assets. • To eliminate diversifiable risk, we extract the portion of the standard deviation that is correlated with the market. • This leaves b, which is our measure of the non-diversifiable risk of an asset.r≡ correlation between asset returns and market returns • Result: expected return on any asset is a linear function of b. • This line is called the Security Market Line (SML) • E(R) = Rf + (E(Rm)-Rf)
Expected Return Security Market Line E(Rm) Rf Risk (beta) 1
Roughly speaking, beta tells us how the asset price tends to move when the market moves. • e.g., Suppose =1.5 for some asset. The asset will tend to move by 15% whenever the market moves by 10%. • Do assets with negative betas exist? After all, E(R) < Rf • Yes! Such assets provide insurance on the portfolio
Miscellaneous Notes • If markets are efficient, investing is nothing more than choosing a and a method to achieve it. • invest in a combination of the risk-free and a market index • Portfolio betas • The beta of a portfolio is the weighted average of the betas of the individual assets in the portfolio: p = wAA + wBB + … • The weights are the fraction of our money we have invested in each, with short positions having negative weights • example: Suppose we have $10,000 to invest and that we short $6,000 of one asset. We then invest $16,000 into a second asset. • w1 = -$6,000/$10,000 = -0.6w2 = $16,000/$10,000 = 1.6
Problems with using the CAPM • What is the market portfolio? • can include every conceivable asset (stocks, bonds, baseball cards, ostrich eggs, etc.). • difficult to measure, so we proxy by using a market index (such as the S&P500 or the Russell 3000). • expected return on the market portfolio is difficult to estimate. • def’n: market risk premium (MRP) = E(Rm)-Rf • One study shows that the MRP was about 7.4% from 1926-1999. • Recent evidence suggests that it should be around 4%.
Other factors may be important. • Historical returns may not be representative of future returns. • See spreadsheet example • What if we don’t have historical data for the asset? • find comparables • use common sense • Bottom Line: use the CAPM and common sense to estimate the appropriate discount rate
Applying the CAPM • gives the appropriate rate for discounting cash flows to shareholders • used as part of the WACC calculation • WACC = wdRd(1-T) + wpsRps + weRe • Recall that • wi fraction of firm (using mkt values) financed with type i • T tax rate • Re required return on equity • estimated using CAPM • Rps required return on preferred stock • estimated using D/P • Rd required return on debt
Techniques to estimate cost of debt • #1: Find the yield-to-maturity on the company’s outstanding debt • Potential problems • 1. YTM depends on the maturity of the debt.If the company’s debt has a very long or very short maturity, our estimate may be biased. • 2. The YTM does not reflect the expected return to investors. • 3. The company’s debt may not be publicly-traded • 4. Bonds with embedded options are problematic.
#2: Use the company’s debt rating in conjunction with yield spreads to estimate the company’s cost of debt. • yield spread: the difference between the yield on a bond (or class of bonds) and a corresponding Treasury bond with the same maturity • example: Suppose a company’s debt is rated Baa1 by Moody’s. What is our best estimate of the company’s cost of debt? • Suppose we choose to use a ten-year maturity for our estimates. • From www.bondsonline.com, we see that the yield spread is 107 basis points, or 1.07%. (Note that this is an old estimate). • From www.cnnfn.com, we see that ten-year Treasuries have a yield of 3.89% • Cost of debt estimate = 3.89%+1.07% = 4.96%
Potential problems • The company’s debt may not be rated • The bond may not be an average bond within its ratings class. • #3: Find the cost of debt on comparable companies