Download
1 / 38
440 likes | 772 Views
Phosphorus Nutrition of Canola. Outline: P Nutrition of Canola. What are the nutrient requirements of canola throughout the season? Why is P needed early in the season? Why is placing P near the seed important? How can I be sure P supplies are adequate?

E N D
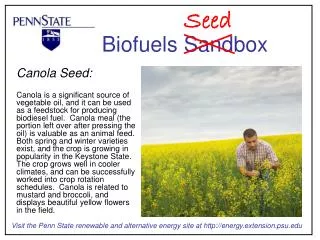
Outline: P Nutrition of Canola • What are the nutrient requirements of canola throughout the season? • Why is P needed early in the season? • Why is placing P near the seed important? • How can I be sure P supplies are adequate? • What are some good strategies for managing P? Photo courtesy of Canola Council of Canada
Average Yield Canada 24 bu/A USA 26 bu/A 35 30 25 20 Canada Canola yield, bu/A United States 15 10 5 0 1986 1987 1988 1989 1990 1991 1992 1993 1994 1995 1996 1997 1998 1999 2000 2001 2002 2003 Year What Have the Trends Been in Canola Yield? NASS; Statistics Canada
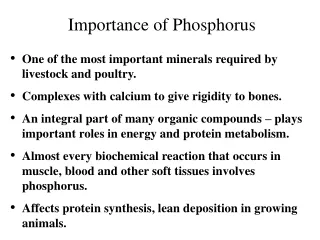
What Is the Role of Pin Plants? • Photosynthesis and respiration • Energy transfer and storage (ATP) • Cell division and enlargement • Transfer of heredity traits • Seed formation
What are the nutrient requirements of canola throughout the season? Photo courtesy of Canola Council of Canada
Plants Take Up P As: • Primary orthophosphate ion:H2PO4- (pH < 7.0) • Secondary orthophosphate ion:HPO4= (pH > 7.0) • The form most common is a function of soil pH – both equally present at neutral pH Solution P
K2O 140 39 bu/A canola 120 N 100 80 Nutrient uptake, lb/A 60 P2O5 & S 40 20 0 5 leaf harvest full pod full flower elongation 50% podded end of flower Growth stage How Much N, P, K, and S Does Canola Take Up Johnston et al., 1999
39 bu/A Canola 180 Seed Straw 160 140 120 Crop removal 0.7 – 0.9lb P2O5/bu 100 Nutrient content, lb/A 80 60 40 20 0 K2O S N P2O5 How Are Nutrients Distributed in Canola at Harvest?
Brassica rapa Brassica napus Seed P and Early Season Canola Growth • Seed P concentrationcan play a major role in early plant growth • Seed P has been found to support canola growth for about 7 days • After that period the seedling requires an external P source, either from soil or fertilizer to optimize growth Photo courtesy of Canola Council of Canada
Canola Plant P Acquisition Strategies • Canola has been shown to release organic acids from its roots, acidifying the rhizosphere, and increasing soil P availability • Canola produces longer root hairs than many plants, increasing the soil volume from which it can absorb P • In addition, canola root hair length and density increases as P supply decreases, further helping to access soil P Photo courtesy of Neil Harker
Solution P Labile P Non-labile P What Happens to Fertilizer P After I Apply It? • Absorbed by crop in year 1: • 10 to 30 % of applied P • Highest on low P soils • Labile P (future years): • 70 to 90% of applied P • Future supply • Metastable Ca-phosphates and adsorbed P
3.5 128% Tops 3 Roots 153% 100% 2.5 2 100% Dry matter yield, g/pot 1.5 1 145% 100% 106% 100% 0.5 0 Firdale - Firdale - Lakeland - Lakeland - CK Fert CK Fert Response of Canola and Wheat to Fertilizer P Strong and Soper, 1974
14 Soil P 12 Fert P 46% 41% 10 41% 48% 53% 8 P uptake, mg/pot 51% 6 58% 4 2 0 Rosette Bolting First Harvest flower Proportion of Fertilizer P Taken Up by Canola Karla and Soper, 1968
Impact of Fertilizer P Placement Photo courtesy of Roley Rumbold
Lower Pconcentration Diffusion Plant root Higher Pconcentration The primary cause of low short-term uptake of P fertilizer is: • The inability of P to move to absorbing roots • Solution:Roots adapt and respond through increased development when they encounter sources of soil and fertilizer P
9 Check 8 P band 7 6 5 Percent of roots in P band 4 3 2 1 0 Canola Wheat Flax Plant Root Growth in P Band Reaction Zone • In this pot study, the proportion of plant roots found in a simulated fertilizer band in the soil is shown • All plants displayed the ability to proliferate root growth in the P fertilizer band area • Canola was by far the crop which showed the greatest root response to the fertilizer P zone in this non-calcareous P deficient soil Strong and Soper, 1974
P Placement Can Influence Crop Response Spring broadcast, 40 lb P2O5/A Seed-placed, 20 lb P2O5/A Agrium
8 bu/A 10 bu/A 160 21 bu/A 21 bu/A 2 140 120 20 bu/A lb P2O5/A 100 80 0 Plant emergence, plants/m 17 bu/A 60 23 46 40 20 0 Seed row 1 in. below row P O placement 2 5 Effect of Seed Row P (as MAP) on Canola Emergence and Yield 10% seed bed utilization Nyborg and Hennig, 1969
N+2/3 band P, 1/3 Seed P N+Seed P N+Band P N+Bcst P Check 0 5 10 15 20 25 30 35 40 Canola yield, bu/A What Role Does P Placement Play inCanola Yield? • Little difference was recorded betweenseed row and banded P when N was banded • The split of P between 1/3 seed row and 2/3 band shows a minor advantage, and is attributed to those sites with cold soils at seeding 75 lb N/A + 25 lb P2O5/A Western Co-operative Fertilizers Ltd.
What Is the Role of P in Balancing Canola Nutrition? Photo courtesy Neil Harker
144% 45 40 106% 35 100% 30 25 Canola yield, bu/A 20 15 10 5 0 90 N 30 P2O5 90 N + 30 P2O5 Fertilizer applied, lb/A Nitrogen x Phosphorus Interactions Lafond, 2003
P2O5 lb/A 40 72 35 36 30 54 25 18 Canola yield, bu/A 20 0 15 10 5 0 0 50 100 150 200 N rate, lb/A Hybrid Canola Response to N and P Rates Karamanos, Unpublished data.
Does P Fertilizer Form Influence Crop Response? • Research evaluating crop response to MAP, DAP and APP has found that all sources give equal crop response • In addition, no agronomic differences have been found between dry and liquid sources • The only exception is rock phosphate which provides limited crop response due to low P solubility Fixen, 1989; Leikam, 1990
Related Impact of P Nutrition in Canola • Phosphorus fertilization can lead to earlier maturity of canola – a major factor improving yield and quality in short-season environments Photo courtesy of Canola Council of Canada
How can I be sure P supplies are adequate? Photos courtesy of the USDA NRCS
What Information Does a P Soil Test Provide? • An index of the amountof plant-available P inthe soil • This index must becalibrated to yield response: • Examine responses to P additions at various soil test levels • Conduct studies across a wide range of soil test levels and environmental conditions
12 0 to 6 ppm P 10 8 6 13 to 19 ppm P Canola yield increase, bu/A 4 2 0 0 10 20 30 40 50 60 70 80 90 100 P O applied, lb/A 2 5 How Is A Soil Test Calibrated to Yield Response? Nyborg, 1975
Example of P Soil Test Calibration Data • Calibration curve indicates which soil test levels tend to limit yields • Data based on P responses observed across several sites and years McKenzie et al., 1995
Critical Soil Test P Level • The results of this calibration data set from Alberta show a critical level of 20 to 25 ppm (40 to 50 lb/A) P • This is the level of soil test P above which only maintenance (starter/removal) application would be required McKenzie et al., 1995
Good Fair Poor What Are the Best Uses for Soil Test P Information? • Estimating average probabilities of crop response • Examining changes in levels over time • Estimating average relative yield response • Estimating a specific probability of response for a given site and year • Estimating a specific relative yield response at a given site and year
What are some good strategies for managing P? Photos courtesy of the USDA NRCS
Approaches to P Fertilization • Sufficiency approach:Apply P to maximizenet returns to fertilizationin the year of application • Strategy: fertilize onlywhen there is a goodchance that a profitableyield response will be realized • Soil test levels kept in lower, responsive ranges • Normally adopted on land leased for short periods of time or when cash flow is limited Relative yield, % Soil test P level
Relative yield, % Soil test P level Approaches to P Fertilization • Build and maintenanceapproach:Remove P as ayield-limiting variable • Strategy: apply extra P(more than expectedcrop removal) to buildsoil tests to levels thatare not yield-limiting • Soil test levels kept in higher, non-responsive ranges • Normally adopted on owned land or land leased for longer periods of time
Summary -P Nutrition of Canola • P nutrition is critical to reaching the attainable yield potential of canola • Canola responds to P deficiencies by changing its root development, forming more root hairs • Canola will concentrate its roots in the area of P fertilizer bands, increasing fertilizer recovery • P nutrition must be part of a management strategy that considers the importance of other nutrients • Land ownership/rental and cash flow have a large impact on the approaches taken to managing soil fertility
International Plant Nutrition Institute (IPNI)655 Engineering Drive, Suite 110Norcross, GA 30092-2604Phone: 770-447-0335; Fax: 770-448-0439www.ipni.net Ref: 06128