Download

1 / 15
150 likes | 266 Views
Pathway analysis using BioConductor. The global test revisited. Overview. Introduction Annotation Pathway analysis Demonstration. Introduction. Pathway Set of related genes Functional Structural Described as lists of gene identifiers Micro array 1000s of tests Description

E N D
Pathway analysis using BioConductor The global test revisited
Overview • Introduction • Annotation • Pathway analysis • Demonstration R User group 6 dec 2005
Introduction • Pathway • Set of related genes • Functional • Structural • Described as lists of gene identifiers • Micro array • 1000s of tests • Description • Location on chip/slide • Sequence ID • On chip replication R User group 6 dec 2005
Feature description • Proprietary ID (Affymetrix/Agilent) • GenBank, RefSeq, EnsembleID • Symbol, LocusLink /Entrez Gene,Unigene • SwissProt • Chromosomal location • EC number, GO, KEGG R User group 6 dec 2005
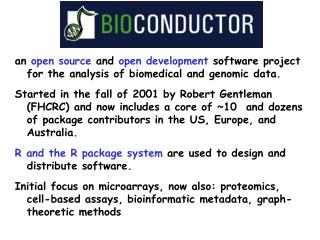
Annotation sources • Batch Gene Finder: http://cgap.nci.nih.gov/Genes • BioMart: http://www.ebi.ac.uk/BioMart/martview • Resourcerer: http://www.tigr.org/tigr-scripts/magic/r1.pl • Bioconductor metadatahttp://www.bioconductor.org • NettAffx http://www.affymetrix.com/analysis/index.affx R User group 6 dec 2005
Create Annotation for Array • Select / create unique identifier for probes on array • i.e. Use positional information b01r03c14 • Use this identifier as rownames of data and annotation • Use annotation sources to connect sequence ids to gene ids R User group 6 dec 2005
Connecting sequence ids to gene ids # 2 matrices, myAnnot and GBFAnnot (from Gene Batch Finder) # Create temporary annotation with correct dimensions tmpAnnot<- matrix("", nrow=nrow(veerannot), ncol=ncol(GBFAnnot), dimnames=list(rownames(veerannot), colnames(GBFAnnot))) ind<-match(myAnnot[,1],rownames(GBFAnnot)) tmpAnnot[!is.na(ind),]<-GBFAnnot[ind[!is.na(ind)],] myAnnot<-cbind(myAnnot,tmpAnnot) R User group 6 dec 2005
Selecting probes by pathway • Using BioConductor metadata package • Using BioConductor GO and Mapping >library(hgu95av2) >get("GO:0005868",envir=hgu95av2GO2PROBE) NAS <NA> TAS <NA> TAS ISS "37300_at" "40318_at" "40319_at" "40949_at" "40950_at" "946_at" > library(GO) > ll<-get("GO:0005868",envir=GOLOCUSID) > rownames(myAnnot)[myAnnot[,”LocusLink”] %in% ll] [1] "Contig51966_RC" "NM_004411" "Contig47291_RC" "NM_006141" [5] "NM_014183" "AB002323" "NM_006519" R User group 6 dec 2005
Pathway analysis • List based methods • Order based methods • Statistical combination of results R User group 6 dec 2005
List based Pathway analysis • Compare the proportion if differentially expressed genes in a pathway to the proportion on the array • R: phyper(), GOHyperG() in GOstats package (BioConductor) • phyper(PWde,ARde,ARall-ARde,PWall,lower.tail=FALSE) >phyper(15,1000,9000,100,lower.tail=FALSE) [1] 0.03910265 R User group 6 dec 2005
Order based analysis • Genes are ordered by difference, from up- to non- to downregulated. Interesting pathways form clusters along this order • In R: Gene Set Enrichment Analysis (GSEA) package http://www.broad.mit.edu/gsea/software/software_index.html R User group 6 dec 2005
Statistical combination of results • All genes in a pathway contribute their statistical influence • In R: globaltest package (BioConductor) R User group 6 dec 2005
Demonstration R User group 6 dec 2005