Download
1 / 11
110 likes | 123 Views
This value map assesses sustainability across agricultural sectors with a focus on farm health, economic ecosystem, and social impact. It provides a detailed analysis using a Likert Scale methodology with weighted divisions.

E N D
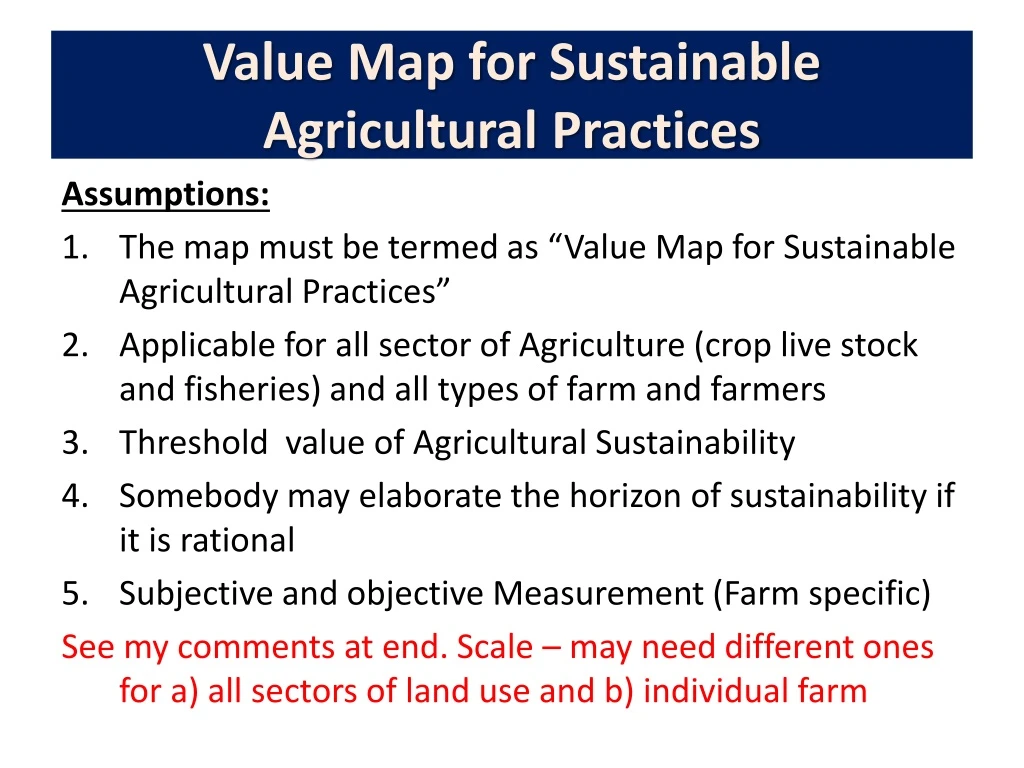
Value Map for Sustainable Agricultural Practices Assumptions: • The map must be termed as “Value Map for Sustainable Agricultural Practices” • Applicable for all sector of Agriculture (crop live stock and fisheries) and all types of farm and farmers • Threshold value of Agricultural Sustainability • Somebody may elaborate the horizon of sustainability if it is rational • Subjective and objective Measurement (Farm specific) See my comments at end. Scale – may need different ones for a) all sectors of land use and b) individual farm
Assumptions (Contd.) • Data collecting Tools: From any arena of science (Physical, chemical, biological, natural, socio-psychological* etc.) • Final Value Map of Sustainable Agriculture must be presented in a pictorial form with Mean, SD, CV, Error Term etc. • …………………….
Farm health Ecosystem • Farmers and residents health (physiological) • Soil health/land Use (points 2 and 3 together) • Seed/ Basic biodiversity • Agronutrients requirement (natural & artificial) • Intercultural Operations • Farm energy system (supply, end use, recycling) • Farm sustainable infrastructure, water, wastes • Climatic impact Stability/ GHG Emission (apparent/ precise) • Resource flows • Healthy (and efficient i.e. high production) products Addressing farm ecosystem as inputs and outputs
Economic Ecosystem • Cost of agri-inputs • Credit (Availability) • Farm Affluence (Machineries, self sufficiency) • Poduction rescue (production and alternate cropping, Reuse of farm resources ) • Storage & Marketing channel • Leftovers (NC, pests, storage, transport and distribution) • Overall Management (Man and Machine) • Utilization of end money • Resilience /adaptability over time
Social Ecosystem • Information mobility • Control and Participation (gender, class, generation …) • Simplicity (user friendly) • Demonstrability educational value, transparency • Social Security (peace and equality) • Socio cultural compatibility / appropriate tech. • Social Utility (technology adoption and dissemination) • Aesthetics • Wellbeing
Methodologies • Total map would be circular with three major arena • Each arena again divided into eight sub-regions (Active) horizontally with five vertical divisions • Each divisions have weighted as ‘1’ and its increase successively from centre to periphery (+1, +2,+3,+4,+5)* Likert Scale There is also 0
Coding • So Range (Expected)= 1- 120 Scaling TitleScoring • +1 = Least Sustainable (1-24) • +2 = Very slightly Sustainable (25-48) • +3 = Slightly Sustainable (49-72) • +4 = Sensibly Sustainable (73-96) • +5 = Sustainable (97-120)
Calculation • Colour should be on each cell on the basis of mathematical scaling (divided into 4 divisions and colour as per average value of sub sets)
………………………………..Chris comments: Great! For further development. I would prefer a tougher definition in the scale, such as starting with 1. “very unsustainable” – meaning high negative impacts on soil, long term productivity, emissions, costly, gender discriminatory, controlled by the corporations not the farmers, etc. Starting point is the farm, fine, but consider its context: all local residents and visitors as part of that farm ecosystem. Impact on neighbouring farms, local aquifer, the local economy, etc. But: farm itself or whole food system??? The transport, refining, packaging stages of the cycle? Sustainable farm or sustainable food production and overall land use? Maybe very useful to develop a Value Map evaluation at both levels: farm only and whole food system. – asfor individual building or whole town.