Download
1 / 86
860 likes | 875 Views
12-Lead EKG MEPN Level IV. EISLO’s. Discuss the changes in T wave and ST segment morphology with an MI List the criteria for identification of right or left bundle branch blocks. List the anatomically congruent leads associated with an inferior, lateral and anterior wall MI

E N D
12-Lead EKG MEPN Level IV
EISLO’s • Discuss the changes in T wave and ST segment morphology with an MI • List the criteria for identification of right or left bundle branch blocks. • List the anatomically congruent leads associated with an inferior, lateral and anterior wall MI • Describe morphology of Q wave presence
Myocardial A&P http://www.healthline.com/vpvideo/how-the-heart-works
Heart wall - Three layers • Epicardium (outer) • visceral layer of pericardium • thin, transparent • smooth, slippery • Myocardium (middle) • mass of cardiac muscle • Endocardium(inner) • endothelium over thin connective tissue • smooth lining for the chambers and valves • continuous with blood vessel endothelium
Myoglobin Released by all striated muscle Rises fast (2 hours) after myocardial infarction Peaks at 6 - 8 hours Returns to normal in 20 - 36 hours CK Released by all muscles in the body Rises in 4-6 hours after injury Peaks in 24 hours Returns to normal in 3-4 days CK-MB is myocardial “specific” Peaks in 3-4 hours Returns to normal in 2 days Troponin More specific for myocardial injury Rises 2-6 hours after injury Peaks in 12 hours Remains elevated for 5-14 days Cardiac Enzymes
Coronary Blood Flow Arteries • first branches off the aorta • blood moves more easily into the myocardium when it is relaxed between beats during diastole • blood enters coronary capillary beds
Coronary Circulation Pathologies • Compromised coronary circulation due to: • emboli: blood clots, air, amniotic fluid, tumor fragments • fatty atherosclerotic plaques • smooth muscle spasms in coronary arteries • Problems • ischemia (low supply of nutrients) • hypoxia (low supply of O2) • infarct (cell death)
Internodal tracts Bundle of His Right Bundle Branch
AV Node Conduction • Normal conduction pathway from atria to ventricles • Limits number of atrial impulses sent to the ventricles
Phase 0 Begins at -70 mV with a slow influx of sodium ions; gradually raising the potential toward threshold When threshold is reached fast sodium channels open; causing the cell to fire Phase 1 Rapid sodium pumps are slowed by influx of potassium Phase 2 Plateau phase Sodium influx slows; calcium begins to enter the cell Calcium stimulates cellular contraction by stimulating the myocyte Phase 3 Reverse pumps open; rapid repolarization Phase 4 Back to the -70 mV resting potential Action Potential
Myocardial Action Potential • Depolarization • Phase 1 of the action potential • Stimulation of the cardiac cell by the pacemaker cell causing an influx of Na and Ca, outflow of K. • Repolarization • Phase 2 of the action potential • No impulse entering the cells can cause it to depolarize • Relative refractory period • Phase 3 of the action potential • Impulses entering the cardiac cell now can cause serious, uncontrolled reactions. • Absolute refractory period • Phase 4 of the action potential • The return of the cardiac cells to resting state.
EKG Basics • 25 mm per sec • Each small box - horizontally = 0.4 sec • Each small box - vertically = 1 mm
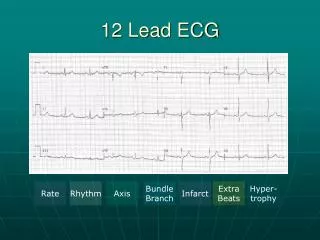
EKG Review - Analysis • Rhythm • Regular or irregular • Rate • Too fast, too slow, just right • P waves • Upright, inverted, not there, not related • P-R Interval • 0.12-0.20; >0.20; <0.12 • QRS complex • <0.12 • QT Interval • .34-.44
P wave: Represents positive and negative deflections of atrial contraction and relaxation • PR Interval:Distance between the P wave and the Q/R wave .12 -20 • QRS Complex:represents ventricular depolarization • Q wave:First negative deflection • R Wave:First positive deflection • S Wave:second negative deflection • ST Segment:Essentially isoelectric, slopes gently upward • Normal > .08 sec • J point:the point where the S wave meets the isoelectric line • T Wave:Ventricular repolarization • always upright in leads I, II, V2-V6 • aVR is always negative. • Leads III, aVL, aVF, and V1 can be positive or negative • U Wave:unclear etiology, commonly seen in V2-V3 due to proximity to ventricular mass; common in bradycardia, hypokalemia, digitalis
QT interval • beginning of the QRS complex to the end of the T wave represents ventricular depolarization and repolarization ---- Changes with heart rate • QTc • QT corrected for heart rate QT / R-R = QTc • Evaluates the recovery of the ventricle
ECG Leads • 6 limb leads (frontal plane) • 3 bipolar leads • 3 unipolar leads • 6 precordial leads (horizontal plane) • V1 – V6
Einthoven’s Triangle Limb Leads BIPOLAR • Lead I • RA (-) to LA (+) • Lead II • RA (-) to LL (+) • Lead III • LA (-) to LL (+)
AUGMENTED (UNIPOLAR) LEADS Augmented leads combine 2 leads together (the null point) from the center point of the triangle with one positive pole. aVR (Augmented Voltage Right Arm positive) is a combination of bipolar Leads I and II aVL (Augmented Voltage Left Arm Positive) is a combination of I and III aVF (Augmented Voltage Left Foot positive) is a combination of Bipolar Leads II and III
I & AVL II, III & AVF WHAT ARE THE LEADS LOOKING AT? LIMB and AUGMENTED LEADS
Precordial Lead Placement • V1 – 4th intercostal space right of sternum • V2 - 4th intercostal space left of sternum • V4 – 5th intercostal space midclavicular line • V3 – midway between V2 and V4 • V6 – 5th intercostal space midaxillary line • V5 – same level as V4 at anterior axillary line between V4 and V6
RIGHT SIDED EKG Same lead position as left side – looks directly at the Right ventricle
Posterior View Posterior leads: V7 – lateral to V6 at posterior axillary line V8 – level of V7 at the mid-scapular line V9 – level of V8 at the paravertebral line (left posterior thorax midway from spine to V8)
V3 & V4 V1 & V2 V5 & V6 PRECORDIAL LEADS
calibration marker LIMB LEADS AUGUMENTED LEADS PRECORDIAL LEADS Bottom line is continuous strip
Myocardial ischemia • Various definitions are used. The term commonly refers to diffuse ST segment depression, usually with associated T wave inversion • Myocardial injury • Injury always points outward from the surface that is injured with ST segment elevation • Myocardial infarction • death of heart muscle
ST Segments ST segment should be electrically neutral
Visual aid in determining: • Ischemia or injury to myocardium • Normal should be at baseline • Depressed ST segment - >2 mm below baseline
ST Segment Elevation • ST segment elevation is attributed to impending infarction • but can also be due to pericarditis or vasospastic (variant) angina. • The height of the ST segment is measured at a point 2 boxes after the end of the QRS complex • significant if it exceeds 1 mm in a limb lead or 2 mm in a precordial lead.
T Waves • T waves are normally positive in leads with a positive QRS • T waves are normally asymmetrical • T waves are normally not more than 5 mm high in limb leads or 10 mm high in precordial leads or 2/3 the height of the R wave
T wave Ischemia Ischemia Hyperkalemia Ischemia
Hyperkalemia EKG 3
ST-T Wave • Combination of infarction and often hyperkalemia • Called Tombstone ‘T’ because of the shape. • Usually a sign of impending cardiac death.
Localization of ECG Pathology • Inferior: Abnormalities that appear in leads II, III, and aVF (called the inferior leads) indicate pathology on the inferior or diaphragmatic surface of the heart. • Lateral:Leads I, aVF, and V5-V6 are called lateral leads. Abnormality in these leads indicates pathology on the lateral, upper surface of the heart. • Anterior: Anterior pathology is seen in leads V1-V4, and often in lead I.