Download
1 / 26
260 likes | 372 Views
Hadronic Substructure & Dalitz Analyses at CLEO. Mats Selen, University of Illinois HEP 2005, July 22, Lisboa, Portugal. Outline. Why the interest in charm Dalitz Plot (DP) analyses? Results from CLEO D 0 → K + K - p 0 D 0 p + p - p 0 D 0 K s 0 0

E N D
Hadronic Substructure & Dalitz Analyses at CLEO Mats Selen, University of IllinoisHEP 2005, July 22, Lisboa, Portugal
Outline • Why the interest in charm Dalitz Plot (DP) analyses? • Results from CLEO • D0 → K+K-p0 • D0 p+p-p0 • D0 Ks00 • What CLEO-c will do for CKM angle g/f3.
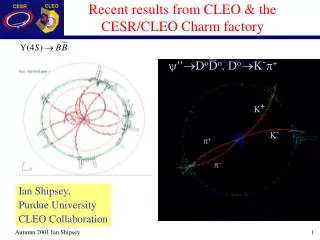
CLEO Evolution CLEO II.V (9/fb) New RICH New Drift Chamber New silicon New Trigger & DAQ CLEO III (14/fb) Replace siliconwith a wire vertex chamber CLEO-c (281/pb)
Why bother? • Need to understand the brown muck. • Final state interactions are tricky • Relative amplitudes and phases hard to calculate – must measure. • Need to sort out the best way to model ≥ 3 body decays • Isobar, K-matrix, … • People have not always agreed on best approach • Important engineering measurement for getting the most out of b-factory data. • For example, extracting f3 from BDK
The power of the DP approach • Interference is a beautiful thing ! • Phase sensitivity is a very important handle Example: D0 K- p+ p0
4.1% K*(1430)0 79% r(770) 16% K*(892)- 13% K*(892)0 3.3% K*(1430)- 5.7% r(1700) 7.5% non-res 1.3% K*(1680)- + a3 a1 eif3 + a4 + a2 eif4 eif1 eif2 eif8 + a5 eif7 eif5 + a6 + a7 + a8 eif6 =
Relevance to f3 • There are several schemes to access g/f3 by exploiting interference in the decays of charged B mesons to charm: B DK • D K*K • Grossman, Ligeti, Soffer PRD 67 (2003) • Suprun, Rosner PRD 68 (2003) • CLEO analysis of D0 K+K-p0 • D 3-body/Dalitz • Giri, Grossman, Soffer, Zupan PRD 68 (2003) • CLEO analysis of D0 KSp+p-, p+p-p0
D0K+K-p0 • Method for measuring CKM phase f3 by looking at B± → (K*+ K-)DK ± and B± → (K*- K+)DK ± • Needs a measurement of the strong phase difference dD between D0 → K*+ K– and D0 → K*– K+. • Dalitz analysis of D0 → K+K-p0 will yield dD d=180 d=0
D0K+K-p0 CLEO III ¡(4S) Region: 8.965/fb D*+ → p+ D0 → K+ K–p0 → gg K±Kmp0 signal region mK+p02 (GeV/c2)2 (after selection criteria) f Signal Fraction » 77.4% Signal Events »565 (in the signal region) K*+ K*- mK-p02 (GeV/c2)2 mK+K-p0 (GeV/c2)
D0K+K-p0 Preliminary Fit Statistical errors only
Fit projections reveal a feature/problem… K*- K*+ mK+p02 (GeV/c2)2 mK-p02 (GeV/c2)2 dips are we missing some physics ?? Exploring K-p P-wave K-matrix approach
f3 from 3-body final states s b c u b s c u u u u u Access f3 via interference between B± D0K± and B± D0K± favored suppressed KS, p0 p+ p- B± K±
Amplitude differences willbe sensitive to f3. ~ ~ D+ D- Where is the amplitude of the D0 matrix element at the point on the Dalitz Plot, and Once has been determined (where we come in) then D+ and D- Dalitz plots can be fit to determine f3. ~ ~ ~ D KS-+ BELLE 253/fb m- m- (From B± decays) m+ m+
D0p+p-p0 • Useful for studying f3 in charged B decays. • Like D0KSp-p+(discussed later) • Good system for CP violation search. • Some predictions as high as 0.1% (ref) • Compare to D+p+p-p+ • Has large S-wave component (FOCUS ref)
0 1 2 3 m2(p+p0) (GeV2) D0p+p-p0 S/(S+B) ~ 80% S ~ 1100 9.0/fb m2(p+p0) (GeV2) m2(p+p-) (GeV2) 0 1 2 3 0 1 2 3 m2(p+p-) (GeV2) m2(p-p0) (GeV2)
p+p- proj < 6.4 @ 95% CL 0 1 2 3 GeV2 < 0.21 @ 95% CL 0 1 2 3 GeV2 See Au, Morgan, Pennington PRD 35, 1633 (1987) < 1.9 @ 95% CL 0 1 2 3 GeV2
D0p+p-p0 • Only rp contributions plus small non-resonant component are required to fit Dalitz plot. • Very small D0p+p-p0 S-wave fit fraction (<0.9%) compared to FOCUS (56%) for D+p+p-p+ • D+p+p-p+ / D0p+p-p0 S-wave ratio > 36@95%CL • Tree level estimate = • Flavor tagged D0 and D0 Dalitz plots also fit separately to limit DP integrated CP asymmetry: • ACP =
S/(S+B) ~ 70% S ~ 700 D0 Ks00 m2(p0p0) (GeV2) • Lots of brown muck • Complement KSp-p+ analyses • Good place to search for low mass pp • No r00 to get in the way! m2(KSp0)RS (GeV2) K*(890) + K0(1430) + f0 + NR K*(890) + K0(1430) + f0 + NR + s 0 1 2 0 1 2 m2(p0p0) (GeV2) m2(p0p0) (GeV2)
CLEO-c data (165 pb-1) CLEO-II.V & III (~15 fb-1) S/(S+B) ~ 70% S ~ 700 S/(S+B) ~ 72% S ~ 1500 m2(p0p0) (GeV2) m2(KSp0)RS (GeV2)
What CLEO-c will do for f3 The determination of is presently the limiting systematic • Belle and BaBar have studied the dependence of f3 on the D decay model (analysis used D0 Ks+-) • Belle - Phys.Rev.D70:072003,2004 hep-ex/0406067 • BaBar – ICHEP04 paper hep-ex/0408088 D Decay Model Systematic Uncertainty
2 0 1 2 3 0 1 2 3 0 1 2 3 m2(KSp-) (GeV2) m2(KSp+) (GeV2) m2(p-p+) (GeV2) S/(S+B) ~ 98% S ~ 5300 CLEO-II.V D0 Ks+- Rather low statistics compared to… m2(p-p+) (GeV2) 1 0 0 3 2 1 m2(KSp)RS (GeV2)
BaBar data with“CLEO” modelnot so good 2.27x10⁸ BB pairs BELLE fits look like BaBar
Fit with additional resonances much better. This includes BW s1 and s2 with ~10% fit fractions. Causes big systematicuncertainty !
CLEO-c can help • Do simultaneous CP tagged and flavor tagged analysis of D0 Ks+- [only at ’’(3770)] • Suppose we write • We will extract as well as in a model independent way. • This is exactly what the f3 analyses need.
Many other CLEO-c Dalitz plot analyses are in the works: K-p+h p-p+p0 KSKSp0 K-p+p0 KSKp KSK+K- KSp+p0 p+p+p- etc…many others
Conclusions • CLEO has done (and continues to do) groundbreaking work on charm Dalitz analyses. • K-p+p0,p+p-p0,KSp+p-,KSp0,K-K+p0,KSp0p0, ... • Implementation of K-Matrix amplitudes in fits • CLEO-c will open a new window on the charm sector by exploiting quantum correlations: • CP tagged Dalitz Plot analyses • f3, mixing, CP violation, … • Double correlated Dalitz analyses (i.e. DP vs DP) • Stay tuned