Download
1 / 33
350 likes | 498 Views
A synthetic report of r ecent climatic changes and their impacts on energy and water budgets over the Tibetan Plateau (TP). Kun Yang, Jun Qin, Wenjun Tang Institute of Tibetan Plateau Research (ITP) Chinese Academy of Sciences.

E N D
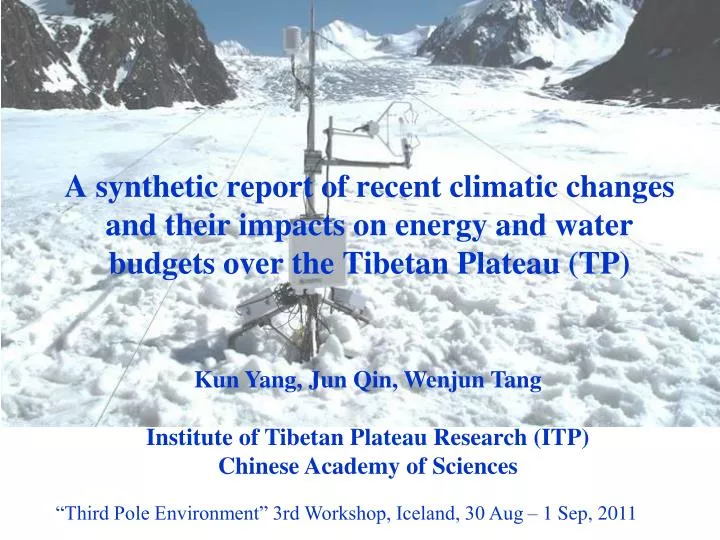
A synthetic report of recent climatic changes and their impacts on energy and water budgets over the Tibetan Plateau (TP) Kun Yang, Jun Qin, Wenjun Tang Institute of Tibetan Plateau Research (ITP) Chinese Academy of Sciences “Third Pole Environment” 3rd Workshop, Iceland, 30 Aug – 1 Sep, 2011
Outline Observed climatic changes Dependence of temperature and wind speed trends on elevation Solar radiation trend across China and TP Thermal response to climatic change Hydrological response to climatic change Potential collaboration in Glacier studies
Climatology of Precipitation in TP Wet in SE-TP, Dry in NW-TP
Climate change during 1984-2006 Tibetan Plateau has been experiencing a rapid warming and wetting while wind speed and sunshine duration are declining in recent decades. (Yang et al., 2011 climatic change)
Altitudinal dependence of recent rapid warming over the Tibetan Plateau Institute of Tibetan Plateau Research, Chinese Academy of Sciences , China Department of Geography, University of Maryland, USA Jun Qin1, Kun Yang1, Shunlin Liang2, Xiaofeng Guo1 (Qin et al., 2009 Climatic Change)
Validate MODIS observed LST trend MODIS warming rate Station warming rate (Qin et al., 2009 Climatic Change)
Warming rate derived from MODIS data 4800m ? • increases with the altitude below 4800 m, • keeps stable above 4800 m, • declines above 6200 m (Qin et al., 2009 Climatic Change)
Wind speed trend in China and TP 1960‐1974 1974‐2002 2002‐2009 Surface wind speed variability increases with elevation
Upper-air wind speed changed similarly! 500 hPa 800 hPa 1960‐1974 1974‐2002 2002‐2009 500 hPa 800 hPa
Differential geopotential heights (North, Middle, South) on 500hPa (from radiosonde) PGF change well corresponds to wind speed change
A number of studies indicate there was a dimming (solar radiation decreasing) in the world since 1960s, but a transition from dimming to brightening at the beginning of 1990s. (Wild et al., 2005 Science) Similar results were reported for China Solar radiation trend across China (Tang et al., 2011 ACP)
Trends at all CMA stations from 1961 to 1989 Diming from 1990 to 2006 No brightening trend (Tang et al., 2011 ACP)
Regional mean trend dynamic harmonic regression Linear fitting The magnitude of solar radiation trend was over-estimated (Tang et al., 2011 ACP)
Is the difference due to station representativeness? all radiation stations all CMA routine stations Time series of sunshine duration (hour/year) during 1961 ~ 2000. (Tang et al., 2011 ACP)
How to explain the trend? Due to pollutants? TP is less polluted area, but the decreasing magnitude over TP is even larger than the average over China (-0.2 Wm-2/a) (Tang et al., 2011 ACP)
Thermal Response to Climate Change over the Tibetan PlateauMethod: combine Surface obs., Satellite and LSM (Yang et al., 2011 J. Clim)
Westerly Heat source Monsoon
Thermal anomaly Monsoon variability
Rn_toa Latent heat release Rn_sfc Sensible heat Atmospheric heating Air Surface Heat source =H + lP + dR where dR=Rn_toa – Rn_sfc
Spatial distribution of the total heat source This spatial pattern is contrast to the one presented in most of previous studies (Yang et al., 2011 J. Clim)
Heat source trends H Rc TH H: decrease, the magnitude is ~ 1/2-1/3 of conventional estimate RC: decrease , the magnitude is ~ 1/2 of conventional estimate TH: decrease, the magnitude is ~ 1/2 of conventional estimate (Yang et al., 2011 J. Clim)
Modeled hydrological cycle response to climate change Runoff anomaly ~Discharge anomaly
Hydrological cycle response to climate change P E Roff SM (Yang et al., 2011 climatic change)
Physical picture of climate change over TP More warming in North than in South Global warming Weaken upper-air PGF Less heat transfer from Plateau Enhance local warming Reduce wind speed Less sensible heat Weaken Bowen-ratio Enhance OLR Heat source decrease Enhance radiative cooling More evaporation Less discharge from Plateau Weaken monsoon
Parlang No.4 Glacier 11.7km2 in area 8 km long Glacier experiments in TP
May 20 to September 9, 2009 Southeast Tibetan Plateau Palong-Zangbu No. 4 glacier ablation zone (2915N, 9655E) / 4800 m ASL The first turbulence station on a Tibetan glacier • eddy-covariance (EC) system (CSAT3; LI-7500) / 10 Hz • CNR1 radiometers • HMP45C temp. & R.H. sensor • mass balance stakes (N=9) (05-20) (06-21) (08-02)
Diurnal variations of the turbulent fluxes LE (W m-2) H (W m-2) Turbulent heat fluxes are not so strong (Guo et al., 2011 BLM)
Ablation and energy budget (Yang W et al., 2011 JGR) Accumulated melt Components contributing to melt Ablation is rapid, and net radiation is the major contributor
A global survey: Rnet/Emelt Tibet Others The ratios for Tibetan glaciers are higher than for other regions
Welcome cooperative work in • Climatic change • Glacier melting modeling • Glacier change Thank you for your attention!