Download
1 / 22
220 likes | 327 Views
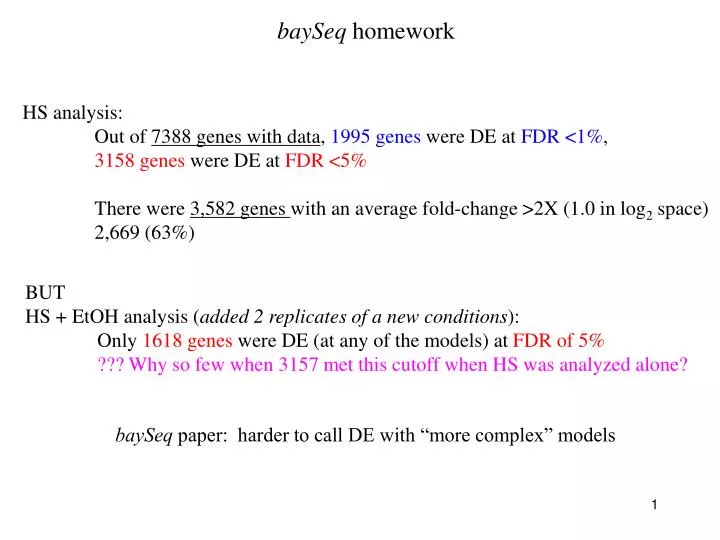
baySeq homework. HS analysis: Out of 7388 genes with data , 1995 genes were DE at FDR <1% , 3158 genes were DE at FDR <5% There were 3,582 genes with an average fold-change >2X (1.0 in log 2 space) 2,669 (63%) . BUT

E N D
baySeq homework HS analysis: Out of 7388 genes with data, 1995 genes were DE at FDR <1%, 3158 genes were DE at FDR <5% There were 3,582 genes with an average fold-change >2X (1.0 in log2 space) 2,669 (63%) BUT HS + EtOH analysis (added 2 replicates of a new conditions): Only 1618 genes were DE (at any of the models) at FDR of 5% ??? Why so few when 3157 met this cutoff when HS was analyzed alone? baySeq paper: harder to call DE with “more complex” models
How well did baySeq do on the HS only analysis? HS log2 fold-change rep1 HS log2 fold-change rep2 3158 genes FDR <0.05 (10K it on prior calc)
How well did baySeq do on the HS only analysis? HS log2 fold-change rep1 HS log2 fold-change rep2 ~50% of these: low counts Many of remaining missed due to day-to-day variation that is not accounted for without pairing the data 902 genes FDR >5% but fold-change >1.5X in both replicates
How well did baySeq do on the HS + EtOH analysis? Models: NDE = 1,1,1,1,1,1 DEH = 1,1,2,2,1,1 DEE = 1,1,1,1,2,2 DEHE = 1,1,2,2,2,2 DEHE2 = 1,1,2,2,3,3 1618 genes FDR <0.05 to at least one DE model
How well did baySeq do on the HS only analysis? But, 1391 genes with FDR > 0.05 to all DE models but at least 1.5X expression change in all 4 samples Why weren’t these identified as DE? 218 of these genes were DE when HS was analyzed ALONE.
Assessing sensitivity (with VLOOKUP in Excel) There were 64 known Hsf1 targets *with data* on the file. My run identified 38 of those at an FDR of 0.01 38/64 59.4% sensitivity 45 were identified at FDR of 0.05% 45/64 70% sensitivity
LAST TIME: Array 1 Array 2 Array 3 Gene X: X1 X2 X3 x coordinate z coordinate y coordinate
LAST TIME: ‘centroid’ (average vector) 4. Centroid linkage clustering
Sometimes, want to use the weighted pearson correlation N 1 (Xi) (Yi) S S x,y = N N i = 1 1 N 2 1 S 2 S Xi Yi N N i = 1 i = 1 Array 1 Array 2 Array 3 Array 4 Array 5 Gene X: X1 X2 X3 X4 X5 Gene Y: Y1 Y2 Y3 Y4 Y5 For example: if these arrays are identical, the data are over-represented 3X
Sometimes, want to use the weighted pearson correlation N 1 (Xi) (Yi) S S x,y = wi S wi N i = 1 1 N 2 1 S 2 S Xi Yi N N i = 1 Where wi= 1 Li Array 1 Array 2 Array 3 Array 4 Array 5 Gene X: X1 X2 X3 X4 X5 k = array corr. cutoff d = Pearson distance (= 1 - P. corr) n = exponent (usually 1) Gene Y: Y1 Y2 Y3 Y4 Y5 For example: if these arrays are identical, the data are over-represented 3X -- can weight experiments i = 3,4,5 byw = 0.33
Unweighted Pearson correlation Weighted Pearson correlation
Unweighted Pearson correlation Weighted Pearson correlation
Can also cluster array experiments based on global similarity in expression Alizadeh et al. 2000
Hierarchical trees of gene expression data are analogous to phylogenetic trees A D B Distance between genes is proportionate to the total branchlength between genes (not the distance on the y-axis) E F C Orientation of the nodes is irrelevant …. although some clustering programs try to organize nodes in some way.
Hierarchical trees of gene expression data are analogous to phylogenetic trees A D B Distance between genes is proportionate to the total branchlength between genes (not the distance on the y-axis) E F C Orientation of the nodes is irrelevant …. although some clustering programs try to organize nodes in some way. D B A E F C
Genes involved in same cellular process are often coregulated These genes may not have the same annotation, but still function together and are thus co-expressed
M choose i = # of possible groups of size i composed of the objects M = M ! (M-i)! * i !
Advantages and Disadvantages of Hierarchical clustering Advantages: 1) Straightforward 2) Captures biological information relatively well Disadvantages: 1) Doesn’t give discrete clusters … need to define clusters with cutoffs 2) Hierarchical arrangement does not always represent data appropriately -- sometimes a hierarchy is not appropriate: genes can belong only to one cluster. 3) Get different clustering for different experiment sets THERE IS NO ONE PERFECT CLUSTERING METHOD
k-means clustering Partitioning (or top-down) clustering method -- Randomly split the data into k groups of equal number of genes -- Calculate the centroid of each group -- Reassign genes to the centroid to which it is most similar -- Calculate a new centroid for each group, reassign genes, etc … iterate until stable
k-means clustering Partitioning (or top-down) clustering method -- Randomly split the data into k groups of equal number of genes -- Calculate the centroid of each group -- Reassign genes to the centroid to which it is most similar -- Calculate a new centroid for each group, reassign genes, etc … iterate until stable Centroids
k-means clustering Partitioning (or top-down) clustering method -- Randomly split the data into k groups of equal number of genes -- Calculate the centroid of each group -- Reassign genes to the centroid to which it is most similar -- Calculate a new centroid for each group, reassign genes, etc … iterate until stable What are the disadvantages of k-means clustering?
k-means clustering Partitioning (or top-down) clustering method -- Randomly split the data into k groups of equal number of genes -- Calculate the centroid of each group -- Reassign genes to the centroid to which it is most similar -- Calculate a new centroid for each group, reassign genes, etc … iterate until stable What are the disadvantages of k-means clustering? • Need to know how many clusters to ask for • (can define this empirically) • Genes are not organized within each cluster • (can hierarchically cluster genes afterwards or use SOM analysis) • - Random process makes this an indeterminate method