Download
1 / 27
280 likes | 548 Views
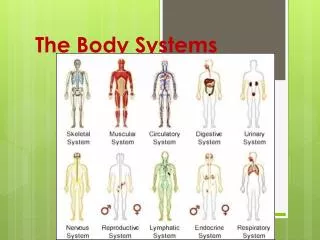
What is a System?. Review Process Flow chart example. 0. 1. 2. 3. Review Process Flow chart example. VA Ratio. Average Working Time per Day = 8hrs. SIPOC. School B. School B. School B. SIPOC: Module Marks processing. Check Inputs Missing students Missing marks Check Outputs

E N D
Review Process Flow chart example VA Ratio Average Working Time per Day = 8hrs
School B School B School B
SIPOC: Module Marks processing Check Inputs Missing students Missing marks Check Outputs Not user friendly Difficult to make academic judgement Check process Some areas of over processing
SIPOC: Booking a Holiday at work Check Inputs Check Outputs Check process
Cross Functional Complexity Table Class Example?
Process mapping: Next Step • Identified Process Steps • Reviewed Inputs/ outputs/ process (SIPOC) • Reviewed cross functional complexity • Next Step identify and review delays
Why do we get delays? • Information missing • Multi departmental inputs • Surge of activity / students all at once • Not enough Staff (capacity) • Not enough facilities • The correct staff are not available • Can you think of any other reason?
Focus on a specific stream Can be carried out at a macro level Micro level analysis can be carried out within points of interest Identify value stream
The current state, depending on the situation, can be developed using any of the following Simple flow chart Single flow Value Stream Mapping (VSM) Cross functional flow chart Cross functional VSM Combination of the above Develop Current State Map
Simple Flow Chart Develop Current State Map Approval 2 (Signature) Dean Student Inquiry about Late Access Info Correct Fill Form Approval 1 (Signature) Supervisor Security Services Produce Swipe Card Info Correct Security Services Post Card to Student
Develop Current State Map • Single Flow VSM with Delays Approval 1 (Signature) Supervisor Approval 2 (Signature) Dean Produce Swipe Card (Security Services) Post Swipe Card (Security Services) Student Inquiry about Late Access Student Fill Form TT: 1 min 10 min TT: 12 min 2 days 4 hrs TT: 1 min TT: 1 min 3 days TT: 20 min 1 day TT: 2 min 10 min 240 min 960 min 1440 min 480 min 1 min 2 min 37 min 12 min 1 min 1 min 20 min 3157 min
Cross Functional Flow Chart Develop Current State Map Student Fill Form Student Inquiry about Late Access Department Approval 1 (Signature) Supervisor Approval 2 (Signature) Dean Info Correct Info Correct Security Produce Swipe Card Post Swipe Card
Value Stream Map Style Develop Current State Map TT: Task Time Work : 8hrs exc. breaks Student Student Inquiry about Late Access Fill Form TT: 1 min 10 min TT: 12 min Department Approval 1 (Signature) Supervisor Approval 2 (Signature) Dean 2 days 4 hrs TT: 1 min TT: 1 min Security Produce Swipe Card Post Swipe Card 3 days TT: 20 min 1 day TT: 2 min 10 min 240 min 960 min 1440 min 480 min 1 min 2 min 37 min 12 min 1 min 1 min 20 min 3157 min
Identify Causes of Delays • Queues • Lack of capacity • Information missing • Non-Value Added Activities • Over processing • Unnecessary signatures • Some information requested on form already available • Motion • Unnecessary motion due to not knowing/where to get certain information • Rework • Due to unavailability of guidelines at key areas
VSM focused on the recruitment process The programme involved a two day workshop The Team Engineering and Computing Faculty Support Manager (X1) Library Administrator (X1) Administration and Marketing Manager (X1) Project Manager IT Services (X1) Business Partner (X2) HR Administrator (X2) HR Assistant director Example: Recruitment Process
How to get times • Team members had information on processing and waiting times • Average times used • Lead-time calculated was in line with the situation under consideration
Prepare AP Business Area Business Area / HR TT : 3 hrs Enter vacancy into database HR HR TT : 2 min Approval Approval Services VC Finance TT : 15 min TT : 15 min 5 days 5 days 10 days 2 days 2 min 3 hrs 15 min 15 min Example: Recruitment Process • Current State Map Development
Identify Non-Value Added Activities • Quantifying proportion of value in the system • Value Added Ratio • Value Added Time : Lead-Time
Areas of concern: A Macro View Waiting for signatures Preparation of job advertisements Coordination of information Short listing process Organisation of interviews Confirmation of pre-employment checks Preparation and sending out of contract documents Example: Recruitment Process
What next Detailed Evaluation of Causes of Delays (23rd March) Solution Development (30th March and 6th April)
Value Stream map example Identify Possible Reasons for Delay in Step 1 and 3 0. Student Contacts programme Manager 1.Delay 2.Programme manager asks Dept registry for enrolment form 3.Delay 4.Only manual enrolment available Reasons for Delay: Reasons for Delay:
Value Stream mapping example Identify Possible Reasons for Delay in Step 1 and 3 0 1 2 3 4 Reasons for Delay: Various responsibilities within role (Lecturing, Project Supervision, Consultancy work with companies, Research work, Other admin tasks) Require input from various functions Reasons for Delay: Records not found Need to request information from other staff Unavailability of standard procedures Appropriate staff to process the query unavailable Various responsibilities within role
For Next WeekSection 1 – 3 A3 problem solving sheet Jimmerson, 2007,A3 problem Solving