Download
1 / 17
250 likes | 877 Views
Phase Changes. Chp 10. Phase Diagrams. Phase diagram = relates physical states of matter (solid, liquid, gas) to temperature and pressure. Phase Diagrams. Triple Point : the only set of conditions where all three physical states can exist in equilibrium. Phase Diagrams.

E N D
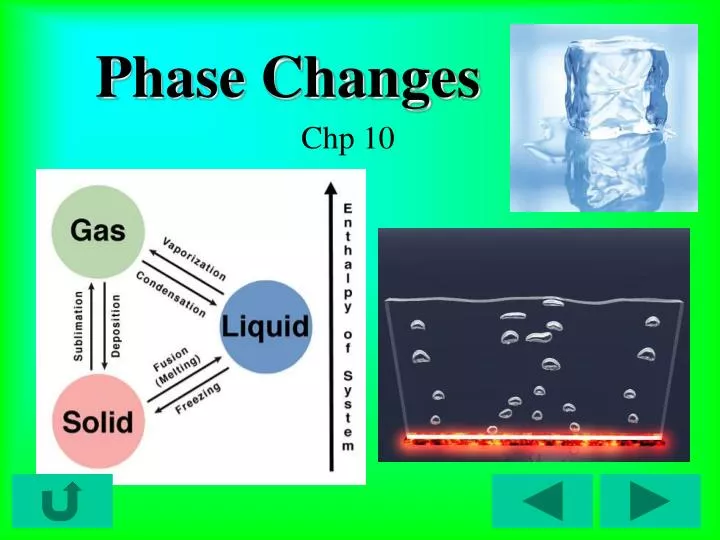
Phase Changes Chp 10
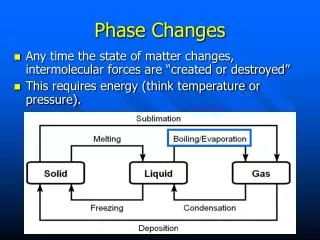
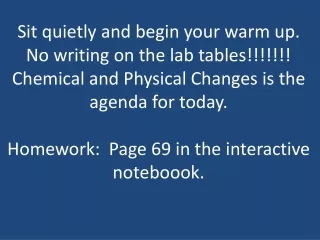
Phase Diagrams • Phase diagram = relates physical states of matter (solid, liquid, gas) to temperature and pressure
Phase Diagrams • Triple Point: the only set of conditions where all three physical states can exist in equilibrium
Phase Diagrams • Critical Point = temperature at which a liquid turns to a gas and cannot be turned back into a liquid, no matter the pressure
Typical Phase Diagram
Phase Diagram For Water
Phase Diagram: • Sublimation = Moving from the solid to gaseous state with out passing through the liquid state • Vaporization of a solid
Uses for sublimation: • Freezing things like freshly brewed coffee, or food for campers and astronauts • Dry ice- carbon dioxide in solid form- keeps things frozen during shipping
Uses for sublimation: • Moth balls: • Naphthalene sublimes into a vapor that keeps moths from damaging clothing and other things
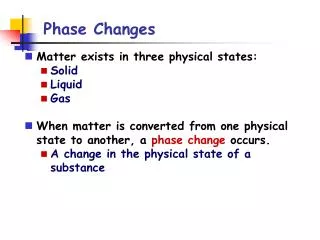
Boiling & Freezing • When a substance boils or freezes (or melts or condenses) the temperature of the system will remain constant (does not change) until the phase change is complete
Boiling • This means, boiling water has a temp of 100oC, not higher. • The temp will begin to rise when all the water is boiled away into steam
Freezing / Melting • This also means melting ice has a temp of 0oC, not lower, not higher. • The temp will begin to rise when all the ice is melted
Vapor Pressure • A liquid will begin to boil when its vapor pressure equals the external pressure • Thus, as the pressure in the room changes, the boiling point of the liquid will change as well.
Vapor Pressure • At standard pressure (1 atm) the temperature at which a liquid will boil is called the normal boiling point • You can use a vapor pressure graph to determine the boiling point of a liquid at any pressure
Vapor Pressure Graph At standard pressure (760mmHg), liquid A will boil around 72oC. Liquid B will boil around 115oC. At what temps will they boil at 400mmHg?
Congrats! You are done the notes! Now, go on to the States of Matter Tutorial Review Click here to go to the States of Matter Tutorial