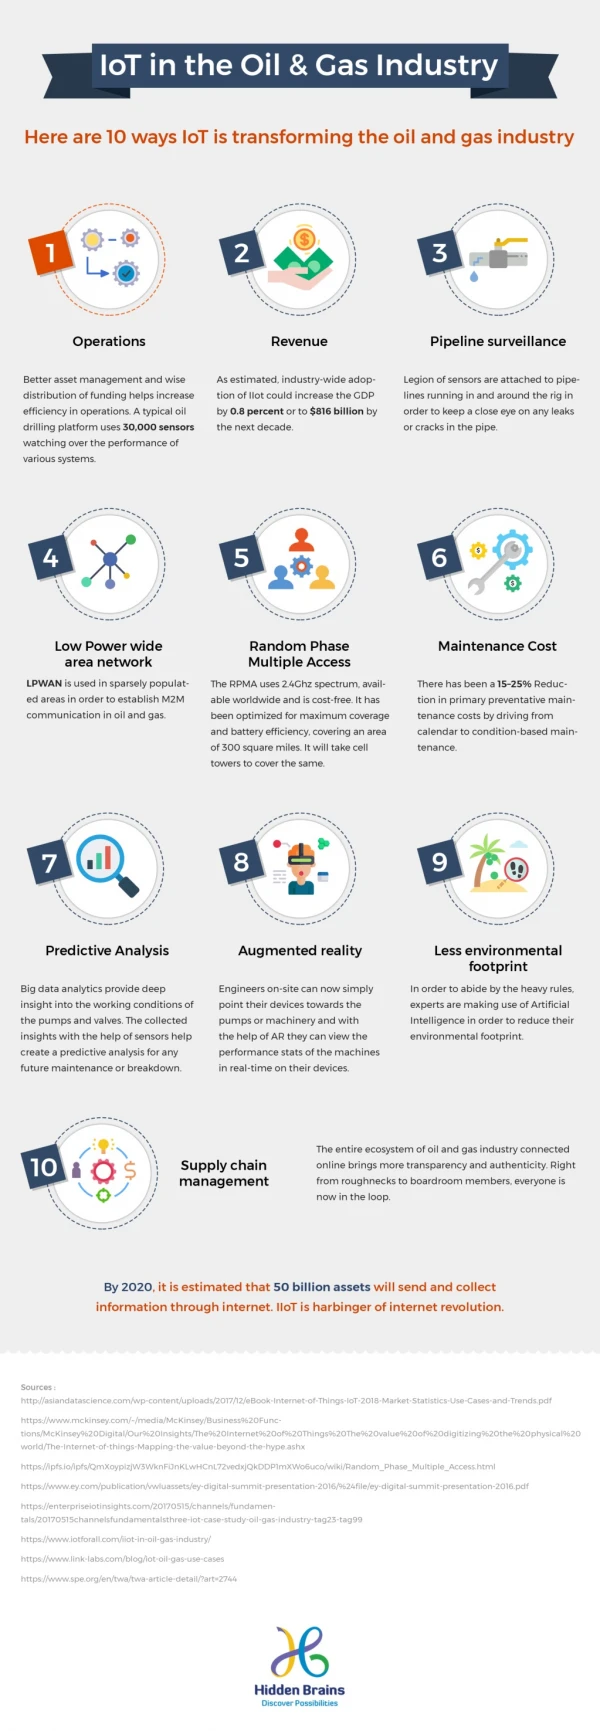
Download
1 / 24
240 likes | 439 Views
US Extractive Industry Overview: Oil, Gas, and Coal. United States Extractive Industries Transparency Initiative Margaret Coleman, Office of Oil, Gas, and Coal Supply Statistics June 12, 2013| Washington, DC. US Extractive Industries include Oil, Gas, and Coal.

E N D
US Extractive Industry Overview: Oil, Gas, and Coal United States Extractive Industries Transparency Initiative Margaret Coleman, Office of Oil, Gas, and Coal Supply Statistics June 12, 2013| Washington, DC
US Extractive Industries include Oil, Gas, and Coal Photo credits: www.condition-monitoring.com, Wyoming State Geological Survey, New York Times, and Getty Images Margaret Coleman, Washington, DC June 12, 2013
Oil, Gas, and Coal make up over 80% of US energy needs Margaret Coleman, Washington, DC June 12, 2013
2011 Energy Use by Sector Margaret Coleman, Washington, DC June 12, 2013
Primary Energy Consumption by Source and Sector, 2011 < 1 27 73 Source: EIA Annual Energy Review, 2011 Margaret Coleman, Washington, DC June 12, 2013
In 2012 US produced 60% of petroleum, 94% of natural gas, >100% of coal domestic demand Margaret Coleman, Washington, DC June 12, 2013
Monthly U.S. crude oil imports and production Margaret Coleman, Washington, DC June 12, 2013
US Oil, Gas, and Coal Industries Resources • Oil and gas sectors comprise both onshore and offshore drilling • Oil, gas, and coal resources may be owned by: • Private land owners • State governments • Federal government • Indian tribes • Individual Indian land and mineral owners • Any combination thereof Margaret Coleman, Washington, DC June 12, 2013
Oil and Gas Industry Overview • Upstream oil and gas industry ~10,000 active companies • About 1 million currently producing wells • 560,000 oil wells • 483,000 gas wells • Over 3 million total wells estimated have been drilled Margaret Coleman, Washington, DC June 12, 2013
Oil and Gas Exploration and Production, Lower 48 • Source: USGS, http://pubs Source: USGS, http://pubs.usgs.gov/dds/dds-069/dds-069-q/graphic/us_production.pdf Margaret Coleman, Washington, DC June 12, 2013
Oil Industry Production Overview • US is the world’s third largest oil producer • Currently producing over 7 million barrels a day (Jan – March 2013) • Production from 31 states and coastal waters off Alaska, California, and Gulf of Mexico • In 2012, ~80% crude oil production from five states and the Federal Gulf: • Texas (31%) • Federal Gulf of Mexico (19%) • North Dakota (10%) • California (8%) • Alaska (8%) • Oklahoma (4%) Margaret Coleman, Washington, DC June 12, 2013
2012 Crude Oil Production by State Margaret Coleman, Washington, DC June 12, 2013
North American Shale Plays Margaret Coleman, Washington, DC June 12, 2013
Tight oil production for selected plays(million barrels of oil per day) Source: U.S. Energy Information Administration based on DrillingInfo, Inc. Margaret Coleman, Washington, DC June 12, 2013
Natural Gas Industry Overview • US and Russia are the worlds’ two largest natural gas producers – produce similar volumes >20,000 bcf annually • 22,902 billion cubic feet dry natural gas produced annually (2011) • Proved reserves of 304.625 trillion cubic feet (2010) • Most natural gas consumed in US produced domestically • Some imported from Canada via pipelines • Small amount shipped to US as LNG Margaret Coleman, Washington, DC June 12, 2013
North American Shale Plays Margaret Coleman, Washington, DC June 12, 2013
Production of natural gas from shale formations has rejuvenated the industry Margaret Coleman, Washington, DC June 12, 2013
Shale gas production (dry) for selected plays(billion cubic feet per day) Source: U.S. Energy Information Administration based on LCI Energy Insight Margaret Coleman, Washington, DC June 12, 2013
2011 Dry Natural Gas Production by State Margaret Coleman, Washington, DC June 12, 2013
Coal Industry Overview • US holds world’s largest estimated recoverable reserves of coal • Enough coal to last more than 200 years based on current production • US is a net exporter of coal (~12% of production in 2012) • In 2012 coal production 1.02 billion short tons (preliminary) • More than 90% of coal consumption is used to generate electricity across all sectors • Electricity generation annual share declined from 49% in 2007 to 37% in 2012 as power producers switched to natural gas Margaret Coleman, Washington, DC June 12, 2013
US Coal Resources and Reserves Margaret Coleman, Washington, DC June 12, 2013
Coal Production by region Margaret Coleman, Washington, DC June 12, 2013
U.S. Energy Information Administration home page | www.eia.gov Short-Term Energy Outlook | www.eia.gov/steo Annual Energy Outlook | www.eia.gov/aeo International Energy Outlook | www.eia.gov/ieo Monthly Energy Review | www.eia.gov/mer For more information EIA Information Center InfoCtr@eia.gov Our average response time is within three business days. (202) 586-8800 24-hour automated information line about EIA and frequently asked questions. Margaret Coleman, Washington, DC June 12, 2013