Download
1 / 4
40 likes | 144 Views
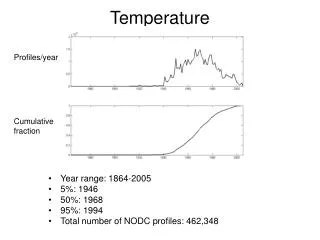
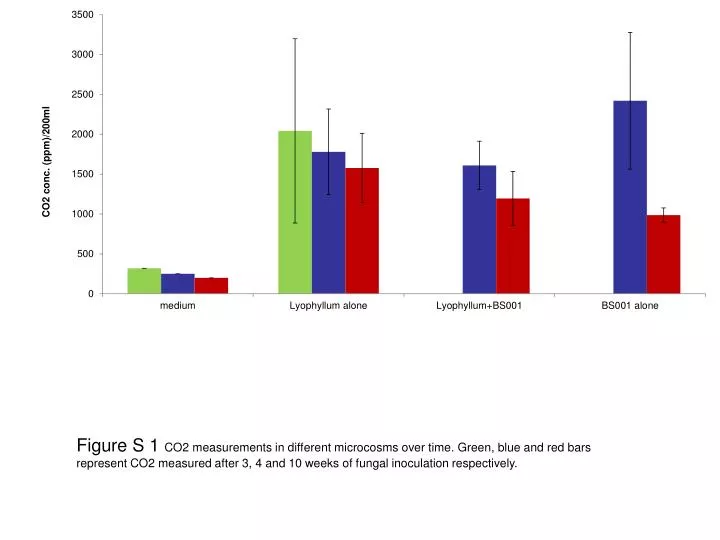
Figure S 1 CO2 measurements in different microcosms over time. Green, blue and red bars represent CO2 measured after 3, 4 and 10 weeks of fungal inoculation respectively. Temperature ( 0 C).

E N D
Figure S 1 CO2 measurements in different microcosms over time. Green, blue and red bars represent CO2 measured after 3, 4 and 10 weeks of fungal inoculation respectively.
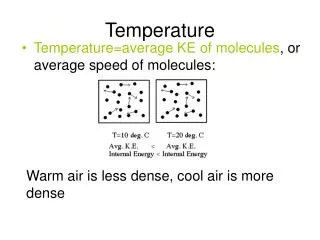
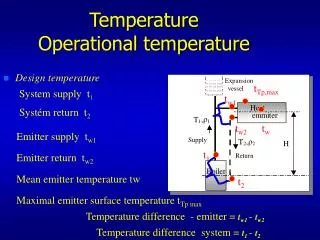
Temperature (0C) Figure S 2 Fluctuations in air temperature over time in the environment where MFM microcosms were incubated.
f+b medium Medium alone f+b exudates Medium +F Glycerol 2 3 Figure S 3 HPLC profiles from different microcosms. x-axis shows the detention time for each compound that is represented as a peak.
m1 Figure S 4 Amount of Glycerol measured in different compartments over time. m; compartment of MFM microcosm below fungal mat in the absence of any bacteria, b; compartment of MFM microcosm beneath fungal mat in the presence of BS001, E; compartment of MFM microcosm on fungal mat surface in the presence of BS001, digits 1,2,3,4 indicate 1st, 2nd, 3rd, 4th sampling after 4, 7, 12 and 15-days of bacterial inoculation respectively.