1 / 3

Global Energy Price Trends 2009-2012: Gas vs. Oil Disparities

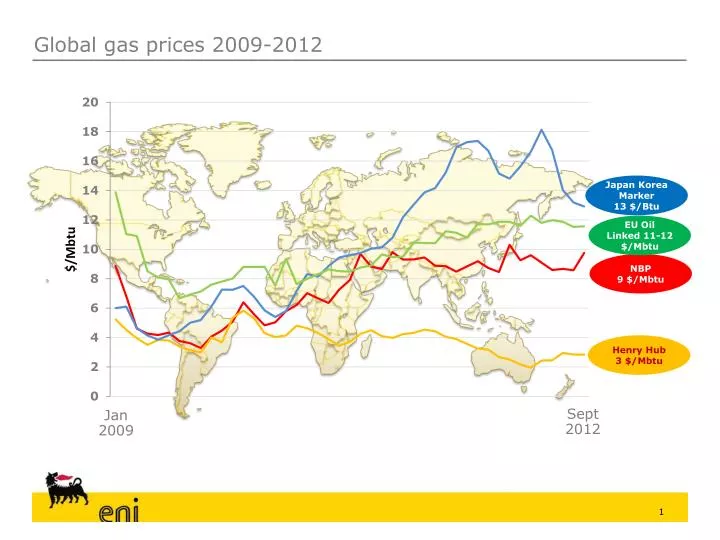
Explore the fluctuations in global gas and oil prices from 2009 to 2012, focusing on the divergence between them and regional disparities. Analyze markers like Japan Korea, EU Oil Linked, NBP, and Henry Hub prices to understand the shift in energy costs. Delve into how WTI prices and Boe values changed, revealing the dynamic nature of the energy market during this period.

nayef
Download Presentation

Global Energy Price Trends 2009-2012: Gas vs. Oil Disparities

An Image/Link below is provided (as is) to download presentation Download Policy: Content on the Website is provided to you AS IS for your information and personal use and may not be sold / licensed / shared on other websites without getting consent from its author. Content is provided to you AS IS for your information and personal use only. Download presentation by click this link. While downloading, if for some reason you are not able to download a presentation, the publisher may have deleted the file from their server. During download, if you can't get a presentation, the file might be deleted by the publisher.

E N D

Presentation Transcript


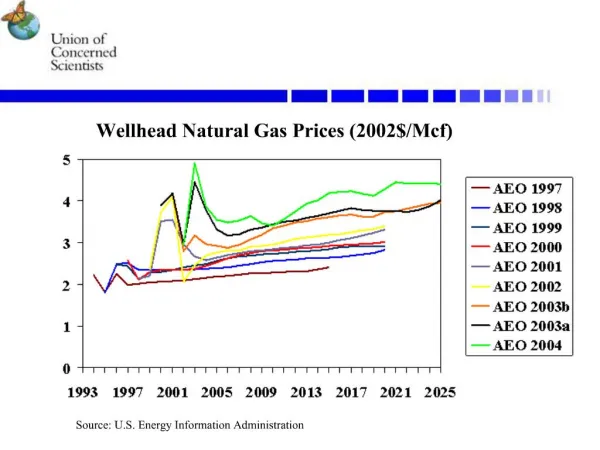
  1. Global gas prices 2009-2012 JapanKoreaMarker 13 $/Btu EU Oil Linked 11-12 $/Mbtu NBP 9 $/Mbtu Henry Hub 3 $/Mbtu Sept 2012 Jan 2009

  2. Divergence between gas and oil (US) WTI 95 $/Boe Henry Hub 17 $/boe Sept 2012 Jan 2008

  3. Energy prices: gas/oil and regional disparities $/Boe Sept 2012 ~113 ~95 ~73 ~55 ~17 WTI

More Related