Download

1 / 13
130 likes | 401 Views
Using Data Visualization Software (Tableau) to Enhance Data Dissemination Deborah Fyler/Marin Clarkberg Institutional Research and Planning Cornell University Nov 2013 http://irp.dpb.cornell.edu/neair-meeting-in-newport-nov-2013. Overview- A tour of Cornell IR use of Tableau About Tableau

E N D
Using Data Visualization Software (Tableau) to Enhance Data Dissemination Deborah Fyler/Marin Clarkberg Institutional Research and Planning Cornell University Nov 2013 http://irp.dpb.cornell.edu/neair-meeting-in-newport-nov-2013
Overview- A tour of Cornell IR use of Tableau • About Tableau • The Cornell Factbook (with a little history) • Surveys • Strategic metrics • Demo using IPEDS data and Tableau
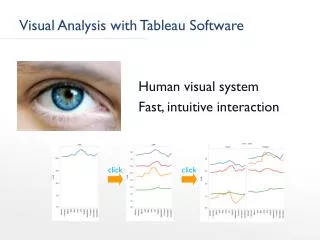
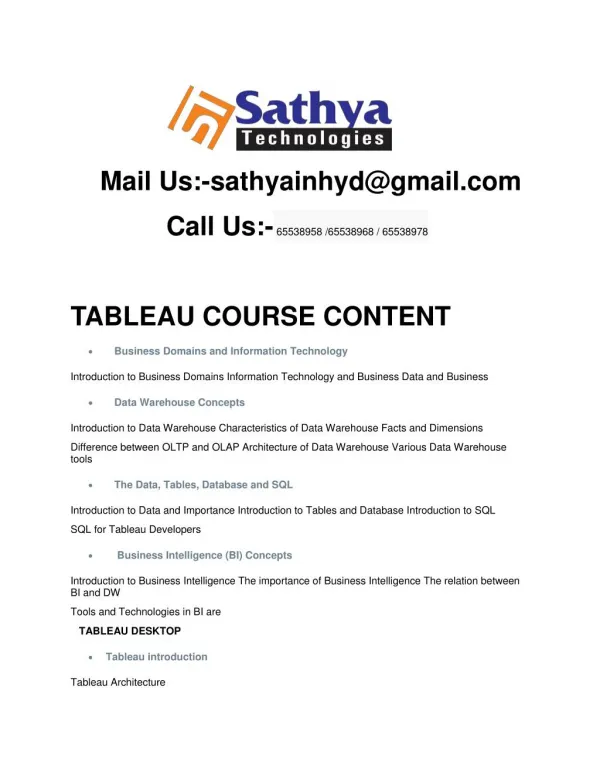
About Tableau • NOT a spreadsheet program, not a statistical package – can’t run regressions • IS an efficient way to produce mountains of beautiful interactive tables and charts (maps, line, heatmaps, dashboards, word clouds, etc.) and put them on websites. • You can customize colors, perform calculations and add annotations. • Don’t need to create endless variations of reports (e.g. a report for every department) • Data consumers can find the data they need easily and without training, and they can slice and dice their data. • Trends become apparentwith easy-to-produce graphs. • Reports can be designed by existing IR staff who know the data well and understand reporting needs. Minimal training needed. Don’t need IT experts. • Access can be finely controlled (public/IR staff/deans/VPs)
The University Fact Book • The Old Way (pre computers and on the web) • The Migration • http://irp.dpb.cornell.edu/university-factbook/factbook-archives
The University Fact Book • The Old Way (pre computers and on the web) • The Migration – changing practice
Cornell Examples http://irp.dpb.cornell.edu/ Enrollment since 1868
Cornell Examples • Factbook • http://irp.dpb.cornell.edu/university-factbook/quick-facts (four data sources) • http://irp.dpb.cornell.edu/university-factbook • Surveys http://irp.dpb.cornell.edu/surveys • New Student: http://irp.dpb.cornell.edu/tableau_visual/2013-new-student-survey • 3. Strategic Metrics • http://irp.dpb.cornell.edu/strategic-metrics
IPEDS demo http://public.tableausoftware.com/views/FinAidFTFTIPEDS/Dashboard1?:embed=y&:display_count=no
Our Website • Website created in Wordpress in 2012 • IR maintains; we can add new pages and graphs) • Structured to allow in-line (in page) Tableau viz (size is specific) • Icon with link to another page (viz) that is template-ed to contain a specific size • And… we also have website links to our secured Tableau server. • Google Analytics: https://tableau.dpb.cornell.edu/t/IRP/views/Websiteanalyticstest/Overall?:embed=y&:display_count=no • This presentation: http://irp.dpb.cornell.edu/neair-meeting-in-newport-nov-2013
http://ryrobes.com/visual-analytics-and-data-porn/between-crazy-genius-bigfoot-aliens-together-at-last/http://ryrobes.com/visual-analytics-and-data-porn/between-crazy-genius-bigfoot-aliens-together-at-last/
For more information please contact: Deborah Fyler (factbook) djf5@cornell.edu Will Searle (surveys) wrs77@cornell.edu Marin Clarkberg (director) mec30@cornell.edu