Download
1 / 30
300 likes | 390 Views
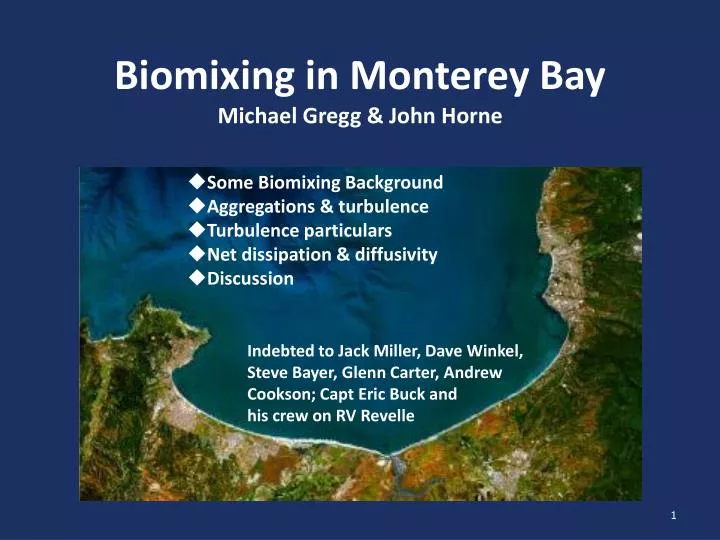
Biomixing in Monterey Bay Michael Gregg & John Horne. Some Biomixing Background Aggregations & turbulence Turbulence particulars Net dissipation & diffusivity Discussion. Indebted to Jack Miller, Dave Winkel , Steve Bayer, Glenn Carter, Andrew Cookson; Capt Eric Buck and

E N D
Biomixing in Monterey BayMichael Gregg & John Horne • Some Biomixing Background • Aggregations & turbulence • Turbulence particulars • Net dissipation & diffusivity • Discussion Indebted to Jack Miller, Dave Winkel, Steve Bayer, Glenn Carter, Andrew Cookson; Capt Eric Buck and his crew on RV Revelle
Bulk Energetics Estimate ofDiapycnal Diffusivity, Kr, by Biomixing • Estimated that 1% of 62.7 TW global primary production produces mixing • Assuming G = 0.2 (mixing efficiency) • Distributing 1 TW of biomixing below euphotic zone in upper 3 km Kr = 2 x 10⁻⁵ m2/s Dewar (2006)
Fish School • Aggregation – fish concentration • Schools – aggregations with uniform spacing and behavior Strobe photo of anchovy school from free-fall camera (Graves, 1977)
Work by Fish in Schools • Work by single swimmer: e = u D [W] • e = (e / rh) (Nf/ V) {h is efficiency} = (1.3 x 10⁻⁵ M1.39 / h) (Nf / V) [W / kg] • Fish density inversely related to body mass, Nf / V = 0.64 M-1.2 • e ≈ 10-5 [W / kg] regardless of mass, i.e., schools of whales and copepods produce the same average dissipation rates
Krill in Saanich Inlet Kunze et al. (2006)
Kunze et al. (2006) Continued • Kr increased from 2 x 10⁻⁶ to 4-40 x 10-4 m2/s, using G = 0.2 • Speculated on possible global significance • In response: • Rippeth et al. (2007) failed to find diurnal increase • Visser (2007) argued that organisms cannot produce overturns larger than themselves. Adapting Richardson’s 4/3 law obtained G = (LThorpe/Lozmidov)4/3 where G is the mixing efficiency
AESOP – August 2006 • Surveying mixing in the • bay • Microstructure lines • repeated for 12.5 hours • RV Revelle
Sv = 10log10(p2scattered/p2incident) • Sv - Volume • Backscattering • Strength
MMP 15017 ReB = e / nN2
Estimating overturns from Temperature Nearly linear TS Over 30-65 m
Thorpe & Ozmidov Scales in Aggregation • Loz = (e/N2)1/3 • Lth from FP07 • Lth = 0.8 Loz • (Dillon, 1982)
Spectra of Dissipation-scale Shear MMP 15017 MMP 15018
Spectra of Dissipation-scale Velocity MMP 15017 MMP 15018
Dissipation-scale Temperature-Gradient Spectra MMP 15017 MMP 15018
Thermal Diffusivity • Rate of thermal dissipation of temperature variability • Cox number • Thermal diffusivity: KT = C kT
Mixing Efficiency, G • Assuming KT = C kT= Kr = Ge / N2 G = C kTN2 / e • Literature: 0.24 (Oakey, 1982), 0.18 (Gregg et al., 1986), 0.15-0.20 (Moum, 1996) • Osborn (1980) assumed 0.2 • G: 0.20, 0.33, 0.24, 0.0078, 0.0026, 0.0015, 0.0019, 0.20, 0.11, 0.0016, 0.0049, 0.02, 0.0012, 0.0014
Conclusions • Largest Aggregations: dz = 60 m, dx = 200 m, • e = 10-6 – 10-5 W/kg, 10 to 1000 times bkg • Overturns (Thorpe scale) << Ozmidov scale • Velocity & Shear spectra narrower than universal spectra • Mixing efficiency, G ≈ 1% of typical values • Negligible net effect of mixing in aggregations
Discussion • Small # samples & probably only 1 species • Extended sections with e ≈ 10-5 consistent with Huntley & Zhou (2004) prediction & Kunze et al. (2006) observation of krill • Visser (2007) prediction of low efficiency prescient even if his rationale is less so. G = Lth2/Loz2 (Visser, 2006) may be upper bound as
Cruising Fish Shed Vertical Vortices • Juvenile mullet, 0.12 m long, swimming in a tank • 2-dimensional particle velocimetry • Two vortex rings per tailbeat cycle with a jet between them • Maximum velocity, 91 mm/s in 2nd vortex from tail • Fish density, Nf/V = 100, would give e = 5.6 x 10⁻⁵ W / kg Muller et al. (1997), Videler et al. (2002)
Discussion Continued • Small overturning scaleslikely result of turbulent production by nearly vertical tail vortices – 3d motions smaller than vortex dia. • Kunze’s finding may result from krill vertical motions rather than horizontal swimming Fini