Download
1 / 17
170 likes | 332 Views
A Comparative Display of Health Outcomes in Eastern North Carolina. Ellen Branch Kaitlyn collins Lauren chandler nobles. Health Outcomes in Eastern N.C. A comparative display of health outcomes in Eastern North Carolina by category of race (white or non-white) and county

E N D
A Comparative Display of Health Outcomes in Eastern North Carolina Ellen Branch Kaitlyn collins Lauren chandler nobles
Health Outcomes in Eastern N.C. • A comparative display of health outcomes in Eastern North Carolina by category of race (white or non-white) and county • Counties were grouped by white, non-white, or evenly balanced (20% or less difference) • Non-white: African American, Asian, American Indian/ Alaskan Native, Native Hawaiian/Pacific Islander, Other, and 2 or more races • Is there a correlation between a person being of a minority race (non-white) and having higher disease (or stroke) mortality rates? • Hypothesis: Being of a minority race (non-white) is positively correlated with a higher disease (or stroke) mortality rate.
Methodology • Comparison Groups: White vs. non-white • Data source: NC Health Data Explorer • Measures: 1 year mortality rates per 100,000 in 2010 for 5 health indicators (white and non-white) • Heart disease • Cancer • Stroke • COPD • Diabetes • Rates were used instead of counts to allow comparison of health events between two populations. • Counties of focus: counties in the Eastern N.C. region • Counties of particular focus include, but are not limited to: Tyrrell, Hertford, Washington, Hyde, Jones, Hoke, Perquimans, Currituck, Greene, Dare, Bertie, Pender, Camden
5 Indicators of Health • According to the North Carolina State Center for Health Statistics, the top five leading causes of death in Eastern N.C. are: heart disease, cancer, cerebrovascular disease, chronic lower respiratory disease, and diabetes. • In place of cerebrovascular disease, stroke is used because it is classified as a cerebrovascular accident. • In place of chronic lower respiratory disease, COPD is used because it is a broad term for chronic respiratory diseases, such as chronic bronchitis and emphysema. • Chronic Obstructive Pulmonary Disease
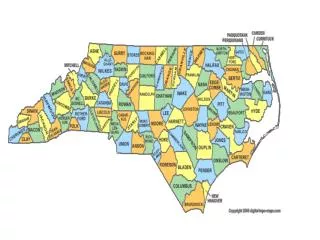
County Groupings Mostly White (19)- Beaufort, Brunswick, Camden, Carteret, Chowan, Columbus, Craven, Currituck, Dare, Gates, Harnett, Hyde, Johnston, Jones, New Hanover, Onslow, Pamlico, Pender, Perquimans Mostly Non-White (5)- Bertie, Edgecombe, Hertford, North Hampton, Robeson Evenly Balanced* (17)- Bladen, Cumberland, Duplin, Greene, Halifax, Hoke, Lenoir, Martin, Nash, Pasquotank, Pitt, Sampson, Scotland, Tyrrell, Washington, Wayne, Wilson * +/- 20% population distribution
5 Indicators of Health: Heart Disease • Heart Disease • Minorities are at a greater risk for heart disease. • African Americans and American Indians/Alaskan Natives are more likely than whites to have high blood pressure. • Mexican Americans are more likely to be obese/overweight. • Both are risk factors
Heart Disease Findings in Eastern N.C. Lowest: Hertford, New Hanover, Hoke, Pamlico, Pender Highest: Tyrrell, Martin, Scotland, Washington, Hyde Lowest: Hyde, Gates, Dare, Tyrrell, Bertie Highest: Washington, Martin, Columbus, Perquimans, Nash Non-whites fare slightly worse than whites for heart disease mortality rates.
5 Indicators of Health: Cancer Cancer • Health care coverage and low socioeconomic status are the most obvious factors that contribute to health disparities in cancer among various racial and ethnic groups. • African Americans have the highest ratesof cancer.
Cancer Findings in Eastern N.C. Lowest: Pitt, Camden, Pamlico, Pender, Perquimans Highest: Tyrrell, Gates, Jones, Washington, Pasquotank Lowest: Dare, Tyrrell, Camden, Perquimans, Martin Highest: Wilson, Lenoir, Pitt, Carteret, Columbus Whites fare worse than non-whites for cancer mortality rates.
5 Indicators of Health: Stroke Stroke • African Americans have a much higher risk of death from strokes than Whites. • Higher risk of controllable risk factors: high blood pressure, diabetes • Uncontrollable risk factors include being African American, Hispanic, or Asian/ Pacific Islander.
Stroke Findings in Eastern N.C. Lowest: Hoke, Lenoir, Dare, Gates, Pasquotank Highest: Jones, Beaufort, Halifax, Greene, Edgecombe Lowest: Perquimans, Pamlico, Currituck, Scotland, Pender Highest: Hyde, Dare, Greene, Edgecombe, Camden Non-whites generally fare worse than whites for stroke mortality rates.
5 Indicators of Health: COPD COPD Age-adjusted death rates are higher among Whites and men. Whites have the highest rates for women, and Native American/Alaskan Native women are 2nd. Hispanics have much lower rates than Whites and other racial groups.
COPD findings in Eastern N.C. Lowest: Greene, Perquimans, Hertford, Halifax, Bladen Highest: Currituck, Camden, Gates, Tyrrell, Martin Lowest: Hyde, Carteret, Washington, Currituck, Camden Highest: Dare, Gates, Scotland, Bladen, Tyrrell Whites fare worse than non-whites for COPD mortality rates.
5 Health Indicators: Diabetes Diabetes • Being of a minority race, especially African American, makes a person at a significantly higher risk for developing Type 2 diabetes than non-Hispanic whites. • Blacks are 1.7 times more likely to have diabetes than whites.
Diabetes Findings in Eastern N.C. Lowest: Tyrrell, Washington, Currituck, Perquimans, Pamlico Highest: Bertie, Hertford, Robeson, Chowan, Hyde Lowest: Camden, Currituck, Pamlico, Carteret, Dare Highest: Pender, Tyrrell, Sampson, Scotland, Wayne Non-whites fare much worse than whites for diabetes mortality rates.
Conclusions • Whites fared worse than non-whites in regards to mortality rates for COPD and cancer. • Non-whites fared worse than whites in regards to mortality rates for diabetes, stroke, and heart disease. • Pender, Dare, Tyrrell, Perquimans, Pamlico, Camden, and Currituck counties were repeatedly (3 or more times) in the category with the LOWEST rates for various indicators. • All listed counties are mostly white, except Tyrrell. • Tyrrell, Martin, Scotland, Washington, Hyde, and Gates were repeatedly (3 or more times) in the category with the HIGHEST rates for various indicators. • A majority of these counties are evenly balanced. • Thus, overall non-whites suffer at a higher rate from the majority of the top five leading causes of death in Eastern N.C. than whites.
SOURCES http://seer.cancer.gov/statfacts/html/all.html http://www.cancer.gov/cancertopics/factsheet/disparities/cancer-health-disparities#4 http://www.cdc.gov/heartdisease/statistics.htm http://www.lung.org/assets/documents/publications/solddc-chapters/copd.pdf http://www.stroke.org/site/PageServer?pagename=RISK http://www.strokeassociation.org/STROKEORG/AboutStroke/UnderstandingRisk/Understanding-Risk_UCM_308539_SubHomePage.jsp www.mayoclinic.com/health/stroke/DS00150/DSECTION=risk-factors www.cdc.gov/diabetes/index.htm http://books.google.com/books?id=5Sn4xuHBfmkC&pg=PA159&lpg=PA159&dq=copd+rates+in+minorities&source=bl&ots=s3EMGQ4E1T&sig=ZtsRjLR2nbFcfhIG0c5jLuVLFzM&hl=en&sa=X&ei=1Et0UcP1MrWu4AOo1oGYBw&ved=0CHcQ6AEwBg#v=onepage&q=copd%20rates%20in%20minorities&f=false