Download
1 / 45
480 likes | 680 Views
Probing the Structure of Low-mass Star-forming Cores with Dust Continuum Emission. Yancy L. Shirley. Collaborators: Claire Chandler, Neal J. Evans II, Jonathan M. C. Rawlings, Chad H. Young. NRAO Colloquium January 2003. Where Do Stars Form ?. NASA Hubble Heritage. Molecular Cloud Complexes.

E N D
Probing the Structure of Low-mass Star-forming Cores with Dust Continuum Emission Yancy L. Shirley Collaborators: Claire Chandler, Neal J. Evans II, Jonathan M. C. Rawlings, Chad H. Young NRAO Colloquium January 2003
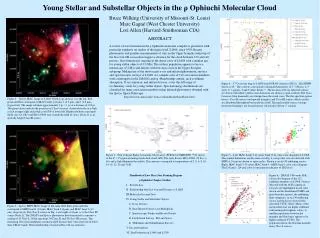
Where Do Stars Form ? NASA Hubble Heritage
Molecular Cloud Complexes Rho Ophiuchus Lupus L. Cambresy 1999
Dense Cores Motte, Andre, & Neri 1998
Isolated Molecular Clouds BHR-71 VLT
Low-mass Star Formation • Star formation occurs within dense molecular cores • Low-mass star formation may occur in isolation or in clustered environments • There exists a putative evolutionary sequence for low-mass star formation • Theories of protostar formation predict the evolution of the core’s density, temperature, and velocity structure • In particular the density structure is a strong discriminator of theoretical models
Low-mass Evolutionary Scheme • Protostar evolves from deeply embedded phase (Class 0) to optically visible T-Tauri star (Class II & III). • Object classified based on shape of the SED: • a(NIR) slope • Tbol • Lbol / Lsmm Figure from P.Andre 2002
SCUBA Survey Shirley et al. 2000, Young et al. 2002 • 16 nights at the JCMT 15-m telescope • 39 nearby (D < 450 pc), low-mass (Lbol < 13Lsun) cores • 6 Pre-Protostellar Cores (PPCs) • 15 Class 0 Cores • 18 Class I Cores • SCUBA 850 & 450 mm jiggle maps (3.5 x 3.5 arcmin) • Sensitivity 20 mJy beam-1 or roughly Av = 3 mag at edge • qmb ~ 15 arcsec at 850 mm • qmb ~ 8 arcsec at 450 mm • 120 arcsec chop throw
Goals of Continuum Survey • Use optically thin submm emission to characterize the envelope structure of star forming cores • Low-mass sample: 500 to 104 AU • Compare evolutionary indicators • Test putative evolutionary scheme for low-mass cores • More realistic density and temperature profiles for radiative transfer models of molecular line observations
Preprotostellar Cores L1544 L1512 L1689B 10,000 AU L1498 B133 L1689A
Class 0 Cores B335 L1527 B228 10,000 AU 10,000 AU IRAS03282 L1448C/N L483
Class I Cores IRAS04166 L43 IRAS04302 10,000 AU IRAS04169 IRAS04248 IRAS04264
Low Mass Evolution ? • Dust continuum emission qualitatively consistent with putative evolutionary sequence • Class I Bias: All but 3 Class I sources located in Taurus Class 0 Class I PPC
Evolutiony Indicators • Tbol and Lbol/Lsmminconsistent Class 0 = Lbol/Lsmm < 200 & Tbol < 70 K
Submm Continuum Emission • Submillimeter continuum emission is optically thin. The specific intensity along a line-of-sight is given by:
Why must we model ? • Rayleigh-Jeans approximation fails in outer envelope of low-mass cores • hn/k = 16.9 K at 850 mm • Heating from ISRF is very important in outer envelopes of low-mass cores • Radiative transfer is optically thick at short l • Observed brightness distribution is convolved with complicated beam pattern, scanning, and chopping
SCUBA Beam Profiles 15.2” 7.9”
Radiative Transfer Procedure nd(r) L kn Sn(l) I(b) Radiative Transfer Simulate Obs. Td(r) Nearly orthogonal constraints: SEDMass x Opacity I(b)n(r) Gas to Dust Physical Model n(r) Iterate Observations
Initial Density Structure • Solutions to the equation of hydrostatic equilibrium: • Bonnor-Ebert spheres: (Bonnor 1956, Ebert 1955) • Limit is Singular Isothermal Sphere (n ~ r-2)
L1544 N2H+ • Pre-protostellar core • Taurus Molecular Cloud • 140 pc • Evidence for extended infall ? Caselli et al. 2002 SCUBA 850 mm SCUBA 450 mm ISO 200 mm 10,000 AU Ward-Thompson et al. 2002 3.5’ x 3.5’ 12’ x 12’
B335 N2H+ • Class 0 protostar in Bok globule • Isolated: 1 deg from Aquila Rift • D = 250 pc • Best collapse candidate Caselli et al. 2002 SCUBA 850 mm DSS - optical SCUBA 450 mm 10,000 AU 3.5’ x 3.5’ 6’ x 6’
Testing Model Parameters • Uncertainty on power law model is • Neglects possible contribution from a disk, outflow, etc.
Class 0 and I Models • Single power law models are good fits • No variation in <p> observed between Class 0 and Class I
Density vs. p • Density of best fit model at 1000 AU vs. p • Class I cores order of magnitude lower density • <n> = 1.2 x 10⁶Class 0 • <n> = 1.5 x 10⁵Class I
Deconvolved Size vs. p • Convolution of a Gaussian beam pattern with a power law intensity profile yields a deconvolved source size that varies with p
Dust-determined Mass • Can use best fit model to determine envelope mass • <M> = 3.00 ± 1.00 MsunClass 0 • <M> = 0.19 ± 0.11 MsunClass I • Are masses indicative of evolution of envelope or is there a bias towards low-mass objects in Taurus? • Inclusion of Visser et al. 2002 data set will elucidate • Determine model “isothermal” temperature • <Tiso> = 11.1 ± 1.2 K PPC • <Tiso> = 12.4 ± 2.0 K Class 0 • <Tiso> = 16.9 ± 3.5 K Class I
Virial Mass • Calculate virial mass from narrow linewidth spectra • N2H+ or H13CO+ • Correct virial mass for: • density power law • thermal component • Virial mass agrees with dust-determined mass within a factor of 2 for Class 0 sources
Gas around Class I • Virial mass does NOT agree with dust-determined mass towards Class I sources • Mv/Md up to 20! • Problem: Gas tracer, such as N2H+ or C18O appears to be probing nearby PPC or background cloud • Looking for a dense gas tracer of Class I envelopes! N2H+ Caselli et al. 2002
Variation of Dust Opacity ? • No evidence for variation in opacity in outer envelope of low-mass cores • Beam convolution cannot be ignored! • Comparison limited between 450 and 850 microns.
Standard Star Formation Models Larson & Penston (69) Shu & Hunter (77) Foster & Chevalier (93) MODEL Critical BE- Sphere INITIAL CONFIG. Uniform n(r) SIS ACCRET.RATE higher const higher initially • Perturbations to Shu77: • ROTATION: TSC (84) • B FIELDS: Galli & Shu (93a,b)
Shu Inside-Out Collapse Model • Initial configuration is SIS (Shu 1977) • Infall radius, rinf, propagates outward at sound speed Animation provided by C. H. Young
B335 Collapse Model • Shu77 collapse model of molecular lines: H2CO and CS by Choi et al. 1995 • Best fit: rinf = 6200 AU
Testing Shu Collapse Models • Best fit model of Choi et al (1995) does not fit! • The infall radius is within the central beam • Density too low by a factor of 5 to match 850 mm flux
B335 NIR Extinction Profile Harvey et al. 2001 • NICMOS H-K color vs. Radius • Outer envelope density profile consistent with dust model • Shu model from Choi et al. (1995) may fit, but NIR extinction map looses sensitivity at R < 5000 AU • Density also too low for Shu model by factor of 3-5
Interferometric Continuum Observations Best fit Model • Probe structure of inner envelope / disk • PdBI 1mm & 3mm images (Harvey et al. 2003) • Power law fit to inner envelope is flatter (n ~ r-1.6) r < 5000 AU • Shu model does NOT fit
Continuum Modeling Summary • PPCs well fitted by Bonnor-Ebert spheres with central densities of 105 to 106 cm-3 • Power law viable because T(r) NOT ISOTHERMAL • Cores with protostars are well fitted by power law density profiles • Low-mass and high-mass distribution similar with p ~ 1.7 • No difference in p observed between Class 0 and Class I cores • Elongated cores appear to be fit by flatter power laws (p ~ 1) • Modeling is consistent with NIR extinction map of B335 • No evidence for infall radius in Shu models of Class 0 sources • Evolutionary indicators, Tbol and Lbol/Lsmm, inconsistent for Class I definition • No evidence for evolution of p with “standard” indicators (Tbol, Lbol/Lsmm, etc.) • Class I dust-determined mass smaller but biased towards Taurus
Modeling Caveats L1544 L1157 • Asymmetric density structure • Observed aspect ratios up to 2 • 3D radiative transfer needed • Effects of outflows • Effects of heating in outflow cavity observed towards a few sources • However, no effect seen at submm l towards B335 • Crowded regions resulting in truncated Router
Caveat : Disk Contribution • Disk may contribute a significant fraction of the emission within the central beam at submm l. • CSO-JCMT interferometer few observed disk fluxes at submm l • Worst-case model indicates flatter p by up to -0.6 • BIMA 2.7mm continuum observations towards Class 0 cores • Shirley et al. 2003, in prep. • L1527, B335, L483, L723 • Strong constraints await submm interferometers
Future Work • Include Visser et al. 2002 Lynds dark cloud SCUBA survey • (Shirley, Chandler, et al. 2003) • BIMA study of low-mass Class 0 cores • (Shirley et al. 2003) • Contribution from a disk • Combination of submm interferometer + single dish bolometer cameras powerful probe of disk and entire envelope • Chemical survey of low-mass regions using density and temperature structure determined by continuum modeling • (Lee et al. 2003) • (Shirley & Wooten 2004) • Includes VLA and GBT projects • SIRTF Legacy: From Molecular Cores to Planet-forming Disks (c2d) (Evans et al.)