Download
1 / 5
50 likes | 109 Views
Enhance your data handling skills by interpreting tally charts and graphs to draw conclusions. Gain insight on various graphs, read tally charts, and contribute to a mind map efficiently. Plan investigations, record information accurately, and pose insightful questions for further analysis. Learn to collect and organize data in tables, study and analyze the information, and present findings with well-labelled graphs. Practice answering questions based on collected data and enhance your data presentation skills effectively.

E N D
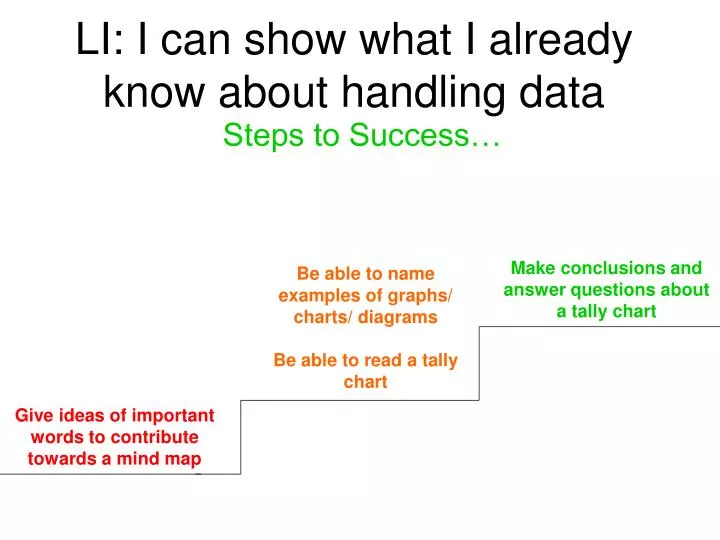
LI: I can show what I already know about handling data Make conclusions and answer questions about a tally chart Be able to name examples of graphs/ charts/ diagrams Be able to read a tally chart Steps to Success… Give ideas of important words to contribute towards a mind map
LI: I can think about what I could investigate, plan how I will find out and predict what might happen Know and use a method of recording the information we find out Steps to Success… Suggest ways the question could be answered Pose a question that could be investigated
LI: I can collect data and put it in a table to help me answer a question Study the data and pose a new question for someone else to answer about it Steps to Success… Use the data collected to draw conclusions and give an answer to the question Record data accurately
LI: I can tell people what I have found out and show some graphs to back up my conclusions Draw an accurate, well labelled graph Steps to Success… Draw a simple graph to show our findings Answer questions about your findings by looking at your data
LI: Steps to Success…