Download
1 / 31
310 likes | 586 Views
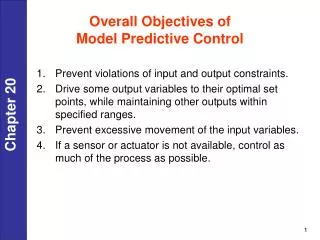
Model predictive control for energy efficient cooling and dehumidification. Tea Zakula Leslie Norford Peter Armstrong. kg oil equivalent/capita . Motivation. Commercial buildings. Transportation. Total U.S. energy consumption. Primary energy use. Residential buildings. Industrial.

E N D
Model predictive control for energy efficient cooling and dehumidification Tea Zakula Leslie Norford Peter Armstrong
kg oil equivalent/capita Motivation Commercial buildings Transportation Total U.S. energy consumption Primary energy use Residential buildings Industrial average Source: The World Bank (2010) Source: U.S. Energy Information Administration (2012) 1 IBO Workshop, Boulder, Colorado, June 2013
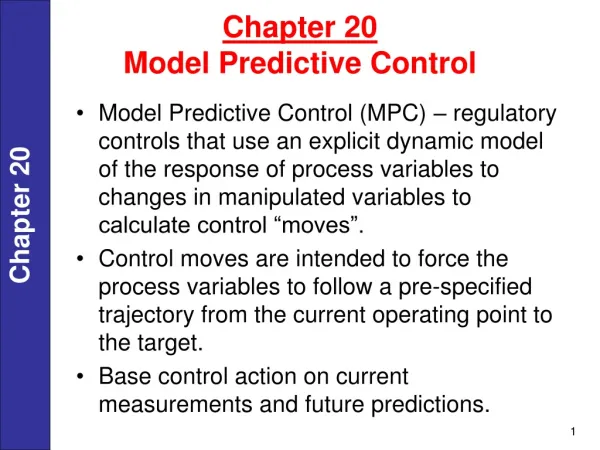
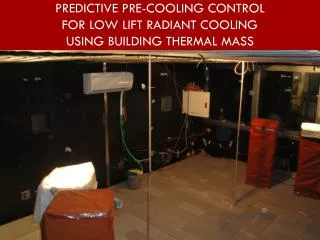
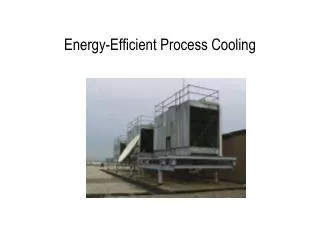
LLCS description Low-Lift Cooling System (LLCS) delivers cold water to Thermally Activated Building Surfaces (TABS). Cooling is optimized by the Model Predictive Control (MPC) algorithm. Model predictive control Building with TABS and thermal storage Heat pump Cold water Ventilation and dehumidification air Dedicated outdoor air system (DOAS) 2 IBO Workshop, Boulder, Colorado, June 2013
LLCS description Model Predictive Control (MPC) – Cooling is optimized over 24-hours for the lowest energy consumption. Building is precooled during night when the cooling process is more efficient. Heat load predictions Model predictive control Zone temperature Temperature limits Occupied Non-occupied Non-occupied Optimized cooling Cool 3 IBO Workshop, Boulder, Colorado, June 2013
LLCS savings strategies Cooling cycle in T-s diagram T Thermally Activated Building Surface (TABS) - increases evaporating temperature and reduces transport power. Thermal storage – reduces condensing temperature, peak loads and daytime loads. Use building as thermal storage saves useful building space. Dedicated Outdoor Air System (DOAS)– provides better ventilation and humidity control. Model Predictive Control (MPC) – enables strategic cooling, shifting cooling toward night time. Toutisde Tfluid s With conventional system With low-lift cooling technology 4 IBO Workshop, Boulder, Colorado, June 2013
Previous work on LLCS Pacific Northwest National Laboratory (2009, 2010)– Proposed LLCS and assessed its performance for 16 different climates and several building types. Showed annual electricity savings up to 70%. Gayeski’s experimental measurements (2010) – Tested LLCS in experimental room at MIT. For a typical summer week showed 25% electricity savings for Atlanta and 19% for Phoenix climate. 5 IBO Workshop, Boulder, Colorado, June 2013
Software environment components Heat load predictions Model predictive control Building with TABS and thermal storage Building data Building model Heat pump Cold water Ventilation and dehumidification air Dedicated outdoor air system (DOAS) 6 IBO Workshop, Boulder, Colorado, June 2013
Building model 7 IBO Workshop, Boulder, Colorado, June 2013
Inverse building model Inverse model of the experimental room – proposed by Armstrong (2009) Tpast For zone, operative and floor temperature: Toutside,past+present For water return temperature: Tpresent Coefficients a … g are found using linear regression to TRNSYS data. Time k=3 k=2 k=1 k=0 Qinternal,past+present Qcooling,past+present 8 IBO Workshop, Boulder, Colorado, June 2013
Software environment components Heat load predictions Model predictive control Heat pump optimization Building with TABS and thermal storage Building data Heat pump Cold water Ventilation and dehumidification air Dedicated outdoor air system (DOAS) 9 IBO Workshop, Boulder, Colorado, June 2013
Heat pump optimization results Toutside = 30oC Tw,return= 11 oC Tw,return= 14 oC Tw,return= 17 oC Tw,return= 20 oC Physics based heat pump model (Zakula, 2010) used to find power consumption in optimal point and optimal set of parameters required to achieve that point. Specific power consumption in the optimal point Parameters required to achieve the optimal point • Evaporator airflow • Condenser airflow • Compressor frequency • Subcooling on condenser 1/COP Qcooling/Qcooling,max Results of static optimization are used in software environment to calculate electricity required for cooling. 10 IBO Workshop, Boulder, Colorado, June 2013
Software environment components Model predictive control Heat load predictions Model predictive control Building with TABS and thermal storage Building data Heat pump Cold water Ventilation and dehumidification air Dedicated outdoor air system (DOAS) 11 IBO Workshop, Boulder, Colorado, June 2013
Model predictive control Find the optimal cooling rates for the lowest electricity consumption over the planning horizon. Planning horizon Qc0 Qc1Qc2Qc23 Cooling rate optimization 0 1 2 23 Time (h) Using heat pump optimization results Using inverse building model 12 IBO Workshop, Boulder, Colorado, June 2013
Model predictive control Qc … cooling rate Tw … water temperature To … operative temperature Tz … room temperature Tfloor … floor temperature Optimization • MATLAB • Optimization of cooling rates • Building response from inverse model • Cooling electricity consumption from heat pump static optimization results Building response Tz,history, To,history, Tfloor,history,Tw,history Execution TRNSYS Building thermal response Optimal values [Qc0, Qc2, …, Qc23] 13 IBO Workshop, Boulder, Colorado, June 2013
Model predictive control main findings • Software environment can be used for the LLCS analysis, but also for the analysis of other heating and cooling systems that employ MPC. • Inverse model can adequately replicate results from TRNSYS. • Model is fast enough for implementation in a real building (computational time to optimize one week is 5 – 10 min). MPC MPC MPC Zone temperature (oC) TRNSYS Inverse model Building with LLCS Building with VAV Building with split-system Time (h) 14 IBO Workshop, Boulder, Colorado, June 2013
Software environment components Heat load predictions Model predictive control Building with TABS and thermal storage Building data Heat pump DOAS configurations Cold water Ventilation and dehumidification air Dedicated outdoor air system (DOAS) 15 IBO Workshop, Boulder, Colorado, June 2013
Proposed DOAS configurations Condenser System B Enthalpy wheel Condenser Evaporator Evaporator Evaporator Evaporator Evaporator Condenser Condenser Condenser Condenser System A Enthalpy wheel System C System D Condenser Enthalpy wheel Enthalpy wheel System E Enthalpy wheel Run-around heat pipe 16 IBO Workshop, Boulder, Colorado, June 2013
LLCS vs conventional VAV LLCS vs VAV with MPC LLCS vs conventional split-system LLCS vs split-system with MPC 17 IBO Workshop, Boulder, Colorado, June 2013
LLCS vs conventional VAV Simulating a typical summer week and 22-week period across 16 climates assuming standard internal loads (from people and equipment) for an office. Evaporator Evaporator VAV LLCS Condenser Condenser DOAS Fresh air for ventilation and dehumidification Air for cooling, ventilation and dehumidification Water for cooling Operated under conventional control (only during the operating hours to maintain constant temperature of 22.5oC) Operated under MPC with temperatures allowed to float between 20 and 25oC during occupied hours 18 IBO Workshop, Boulder, Colorado, June 2013
DOAS configurations analyzed with LLCS Condenser System B Enthalpy wheel Condenser Evaporator Evaporator Evaporator Evaporator Evaporator Condenser Condenser Condenser Condenser System A Enthalpy wheel System C System D Enthalpy wheel Enthalpy wheel Condenser System E Enthalpy wheel Run-around heat pipe 19 IBO Workshop, Boulder, Colorado, June 2013
LLCS vs conventional VAV Results: zone temperatures and cooling rates for Phoenix climate LLCS under MPC Conventional VAV Temperature (oC) Temperature (oC) Time (h) Temperature limits Operative temperature Time (h) Thermal load (W) Thermal load (W) Time (h) Time (h) Internal sensible gain Internal sensible gain TABS cooling rate VAV cooling rate DOAS cooling rate 20 IBO Workshop, Boulder, Colorado, June 2013
LLCS vs conventional VAV Results: LLCS electricity savings for a typical summer week Electricity savings (%) → typical and best performing A LLCS with condenser placed outside C LLCS with parallel condensers, one in supply, the other in return stream D LLCS with parallel condensers, one in supply stream, the other outside E LLCS with condenser placed outside and run-round heat pipe → second best performing 21 IBO Workshop, Boulder, Colorado, June 2013
VAV under MPC Heat load predictions Model predictive control Building data Heat pump Cold air 22 IBO Workshop, Boulder, Colorado, June 2013
LLCS vs VAV under MPC Simulating a typical summer week and 22-week period across 16 climates assuming standard internal loads (from people and equipment) for an office. Evaporator Evaporator VAV LLCS Condenser Condenser DOAS Fresh air for ventilation and dehumidification Air for cooling, ventilation and dehumidification Water for cooling Operated under MPC with temperatures allowed to float between 20 and 25oC during occupied hours Operated under MPC with temperatures allowed to float between 20 and 25oC during occupied hours 23 IBO Workshop, Boulder, Colorado, June 2013
LLCS vs VAV under MPC Results: zone temperatures and cooling rates for Phoenix climate LLCS under MPC VAV under MPC Temperature (oC) Temperature (oC) Time (h) Temperature limits Operative temperature Time (h) Thermal load (W) Thermal load (W) Time (h) Time (h) Internal sensible gain Internal sensible gain TABS cooling rate VAV cooling rate DOAS cooling rate 24 IBO Workshop, Boulder, Colorado, June 2013
LLCS vs VAV under MPC Results: LLCS electricity savings for a typical summer week* Electricity savings (%) Results: LLCS electricity savings from May 1st – September 30th* Electricity savings (%) *LLCS assumes simple DOAS (system A) 25 IBO Workshop, Boulder, Colorado, June 2013
LLCS vs conventional split-system Simulating a typical summer week in Atlanta and Phoenix, and taking into account only sensible cooling (no ventilation and dehumidification system). Evaporator LLCS Split-system Evaporator Condenser Condenser Lower electricity consumption 33% for Atlanta 36% for Phoenix Water for cooling Operated under conventional control (only during the operating hours to maintain constant temperature of 22.5oC) Operated under MPC with temperatures allowed to float between 20 and 25oC during occupied hours 26 IBO Workshop, Boulder, Colorado, June 2013
Split-system under MPC Heat load predictions Heat pump Heat pump Model predictive control 27 IBO Workshop, Boulder, Colorado, June 2013
LLCS vs split-system under MPC Simulating a typical summer week in Atlanta and Phoenix, and taking into account only sensible cooling (no ventilation and dehumidification system). Evaporator LLCS Split-system Evaporator Condenser Condenser Lower electricity consumption 19% for Atlanta 11% for Phoenix Water for cooling Operated under MPC with temperatures allowed to float between 20 and 25oC during occupied hours Operated under MPC with temperatures allowed to float between 20 and 25oC during occupied hours 28 IBO Workshop, Boulder, Colorado, June 2013
Summary of main findings • LLCS saved up to 50% electricity relative to the VAV system under conventional control and up 23% electricity relative to the VAV system under MPC. • A split-system under MPC can have lower electricity consumption than LLCS. • Precooling had important effect for the LLCS. When allowed to precool, LLCS saved up to 20% electricity than otherwise. • Precooling did not have notable effect on the VAV system electricity consumption. • Internal loads, pipe spacing, and heat pump sizing have a significant impact on LLCS savings potential. • A typical DOAS configuration used least amount of electricity. IBO Workshop, Boulder, Colorado, June 2013
Thank you! IBO Workshop, Boulder, Colorado, June 2013