Download
1 / 43
430 likes | 692 Views
Experience Curves and Photovoltaic Technology Policy. Robert M. Margolis Human Dimensions of Global Change Seminar Carnegie Mellon University October 16, 2002. Outline. History/Origins of Experience Curves Background on PV Application to Solar PV

E N D
Experience Curves and Photovoltaic Technology Policy Robert M. Margolis Human Dimensions of Global Change Seminar Carnegie Mellon University October 16, 2002 R. M. Margolis, HDGC Seminar, Oct. 16, 2002, page 1
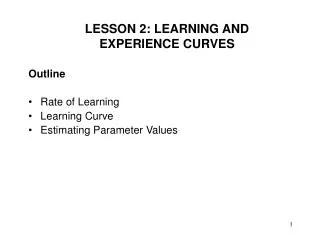
Outline • History/Origins of Experience Curves • Background on PV • Application to Solar PV • Thinking Prospectively Using Experience Curves • Concluding Thoughts R. M. Margolis, HDGC Seminar, Oct. 16, 2002, page 2
Origins of the Learning Curve • The “learning curve” describes how marginal labor cost declines with cumulative production (for a given manufactured good and firm). • Wright’s 1936 study of airplane manufacturing found that the number of hours required to produce an airframe (an airplane body with out engines) was a decreasing function of cumulative airframes, of a particular type, produced. • Learning curves reflect a process of learning-by-doing or learning-by-producing within a factory setting. R. M. Margolis, HDGC Seminar, Oct. 16, 2002, page 3
Origins of the Experience Curve • The “experience curve” generalizes the labor productivity learning curve to include all the cost necessary to research, develop, produce and market a given product. • Boston Consulting Group’s 1968 study across a range of industries. R. M. Margolis, HDGC Seminar, Oct. 16, 2002, page 4
Boston Consulting Group’s 1968 Study • Empirically BCG found that, “costs appear to go down on value added at about 20 to 30% every time total product experience doubles for the industry as a whole, as well as for individual producers.” • In BCG analysis cost included, “all costs of every kind required to deliver the product to the ultimate user, including the cost of intangibles which affect perceived value. There is no question that R&D, sales expense, advertising, overhead, and everything else are included ” (p. 12). R. M. Margolis, HDGC Seminar, Oct. 16, 2002, page 5
The General Form of the Experience Curve is the Power Curve • P(t) = P(0) x [q(t)/q(0)]^-b Where: P(t) = average price of a product at time t q(t) = cumulative production at time t b = learning coefficient • PR = 2^-b Where: PR = progress ratio. For each doubling of cumulative production the MC decreases by (1-PR) percent. R. M. Margolis, HDGC Seminar, Oct. 16, 2002, page 6
Illustrative Learning for Three Progress Ratios Where: P(0) = 100 q(0) = 1 R. M. Margolis, HDGC Seminar, Oct. 16, 2002, page 7
Example from BCG Study: Silicon Transistors, 1954-1969 Key Milestones: 1947: 1st Demonstration (Bell Labs) 1954: 1st Commercial Production (TI) 1960s: Expansion into Televisions (Sony) R. M. Margolis, HDGC Seminar, Oct. 16, 2002, page 8
Why Might Marginal Cost of Production Decline? • Changes in production • process innovations, learning effects and economies of scale. • Changes in the product itself • product innovations, product redesign, and product standardization. • Changes in input prices • Experience curves typically aggregate all of these factors. R. M. Margolis, HDGC Seminar, Oct. 16, 2002, page 9
Distribution of Progress Ratios 22 Field Studies (Dutton and Thomas 1984) Note: These progress ratios are firm level (not industry wide) studies. R. M. Margolis, HDGC Seminar, Oct. 16, 2002, page 10
Distribution of Energy Progress Ratios(McDonald and Schrattenholzer 2001) R. M. Margolis, HDGC Seminar, Oct. 16, 2002, page 11
Background on PV • PV technology overview • Types of cells • PV market overview • Historical Production • Shifting Market Segmentation • PV Module Historical Experience • An Industry Projection R. M. Margolis, HDGC Seminar, Oct. 16, 2002, page 12
Two Main Classes of PV Cells • Mono/Polycrystalline Crystalline Silicon Cells • Industry standard • Multiple cells assembled into a module • Accounted for > 80% production during the 1990s • Thin-film Solar Cells • Main contenders include: Amorphous Silicon,Cadmium Telluride (CdTe), and Copper Indium Diselenide (CIS) • Monolithic design • Emerging technologies • A Single Learning Curve? R. M. Margolis, HDGC Seminar, Oct. 16, 2002, page 13
Global PV Cell/Module Production Note: ROW = Rest of World R. M. Margolis, HDGC Seminar, Oct. 16, 2002, page 14
Shifting PV Market Segments • Industrial (off-grid) • Telcom, Instrumentation, Warning Signals, etc. • Rural (off-grid) • Rural Solar Home Systems, Water Pumping, etc. • Consumer • Watches, Calculators, etc. • Grid-connected • Rooftop, Building Integrated, Central Generation. R. M. Margolis, HDGC Seminar, Oct. 16, 2002, page 15
Example Rural PV Applications PV Water Pumping (Tanzania) Solar Home System (China) Solar Home System (Honduras) R. M. Margolis, HDGC Seminar, Oct. 16, 2002, page 16
Example Grid-Connected Applications Sanyo Building with PV Façade (Japan) BP Service Station (Spain) House with PV Integrated Roof (Japan) R. M. Margolis, HDGC Seminar, Oct. 16, 2002, page 17
An Industry Projection, 2000-2005 1 GW Non-subsidized Residential Rooftops Commercial Building Facades (BIPV) PV Integrate Products Grid-tied Rooftops (Japan, Germany) Remote Habitation Telecommunications Corporate Image (BP) Large Scale Power Off-Grid-Rural Off-Grid Industrial Source: Strategies Unlimited, April 2000 R. M. Margolis, HDGC Seminar, Oct. 16, 2002, page 19
Application to Solar PV • Why should government have a role in encouraging learning? • Summary tables from other studies • A typical learning based projection for PV R. M. Margolis, HDGC Seminar, Oct. 16, 2002, page 20
A Government Role? • Benefits of learning have a tendency to spillover to other firms. • A firm can hire employees from a competitor, use reverse engineering, rely on informal contacts with employees at rival firms, or pursue industrial espionage. • As a result firms tend to under-supply a technology that exhibits strong learning effects. • For a technology that exhibits strong learning effects and provides public benefits, the case for government sponsored demand-pull efforts is particularly strong. R. M. Margolis, HDGC Seminar, Oct. 16, 2002, page 21
PV Progress Ratios R. M. Margolis, HDGC Seminar, Oct. 16, 2002, page 22
PV “Buy-down” Cost Estimates R. M. Margolis, HDGC Seminar, Oct. 16, 2002, page 23
A Typical Learning Based Projection for PV 13,000 MW 51,000 MW R. M. Margolis, HDGC Seminar, Oct. 16, 2002, page 24
Thinking Prospectively • What is the right target level? • Module vs. System Costs • Need to calculate impacts relative to a baseline • Single progress ratio is an over simplification • What are realistic cost reductions over time? R. M. Margolis, HDGC Seminar, Oct. 16, 2002, page 25
What’s the Right Target Level? • Depends on targeted application • Rooftop/BIPV: Retail Electricity Rate • Large-Scale Power: Wholesale Rate • Telecom: Currently competitive in many remote locations • Solar Home Systems: Economically viable when remote from the grid R. M. Margolis, HDGC Seminar, Oct. 16, 2002, page 26
Average Residential Electricity Prices for Selected Countries, 1997 R. M. Margolis, HDGC Seminar, Oct. 16, 2002, page 27
PV System vs. Electricity Costs R. M. Margolis, HDGC Seminar, Oct. 16, 2002, page 28
Module vs Systems Costs • Really a compound learning curve • PV module • Balance of System components • Rooftop/BIPV offers many opportunities for cost reduction • Elimination of Storage • Substitute structurally • Elimination of frame • Installation • Different components may have different learning rates. R. M. Margolis, HDGC Seminar, Oct. 16, 2002, page 29
Impacts Relative to a Baseline • PV has niche markets that are likely to grow • Can target subsidies (as in Japan and Germany) • A simple illustration: • Baseline annual growth: 10% or 20% (?) • Subsidy increases annual growth to 30% • PR = 0.8, System Cost in 1998 = $7/Wp • Achieve $3/Wp: 2020 (10% growth); 2012 (20% growth); 2009 (30% growth). • Subsidy required: All Production = $11 billion; Extra Prod. = $6 billion (increase growth from 10% to 30%); Extra Prod. = $4 billion (increase growth from 20% to 30%). R. M. Margolis, HDGC Seminar, Oct. 16, 2002, page 30
Using a Single Progress Ratio? • There is considerable uncertainty in historical progress ratios • What is the relationship between R&D and progress ratios? • The potential for breakthroughs is difficult to quantify • Results are highly sensitive to progress ratio • Need to include sensitivity analysis. R. M. Margolis, HDGC Seminar, Oct. 16, 2002, page 33
Assumes: System Cost in 1998 = $7/Wp Buy down all systems to $3/Wp R. M. Margolis, HDGC Seminar, Oct. 16, 2002, page 34
PV Budget Comparison (Million US$) Source: Maycock (2002); EIA (2001) * There is considerable activity at the state level in the U.S. R. M. Margolis, HDGC Seminar, Oct. 16, 2002, page 36
What are Realistic Cost Reductions? • Material Costs • Crystalline Silicon: $0.43-0.68/Wp (silicon, glass, EVA, other), for 13% efficient cell (Maycock 1998) • Amorphous Silicon: ~ $0.31/Wp (Carlson 1993) • CdTe: ~ 0.48/Wp (Zweibel 1999) • Average Module Production Cost in 2000 for U.S. PVMaT participating companies was $2.94/Wp • Average Module Price in 1998 was $3.82/Wp R. M. Margolis, HDGC Seminar, Oct. 16, 2002, page 38
Concluding Thoughts • Process of innovation is inherently uncertain • prospects for learning with existing technologies, • breakthroughs (i.e., through R&D investments), • market developments (i.e., how rapidly will the grid-connected and rural home markets grow). • Need to be cautious! • Simplistic use of industry-wide experience curves can easily mask the underlying dynamics of the process of innovation. R. M. Margolis, HDGC Seminar, Oct. 16, 2002, page 40
Concluding Thoughts (cont.) • With respect to PV technology we are in what Cowan (2000) calls the “narrow windows” and “blind giants” stage of technology development.* • There is a wide range of emerging PV technologies. • It is currently unclear which PV technology will dominate the market in the long-run. • Government should strive to encourage the development and diffusion of a diverse set of PV technologies (to avoid lock-in to an inferior PV technology). * That is, effective policy-making is only possible during the early stages of competition between technologies, yet that is when analysts and policy-makers know the least about what to do. R. M. Margolis, HDGC Seminar, Oct. 16, 2002, page 41
Policy Recommendations • Pursue (demand-pull and supply-push) policies that will encourage the range of emerging PV technologies to continue to advance from the laboratory into production: • Demand-pull: net metering, setting interconnection standards, instituting a federal subsidy (tax credit or loan subsidy) for rooftop and building-integrated PV systems, and instituting a renewable portfolio standard (RPS) that would include distributed PV systems. • Supply-push: Expand R&D programs like the Thin-Film PV Partnership project and the PVMaT project. These projects have fostered innovation in a wide array of PV technologies and should continue to pursue a multi-technology strategy. R. M. Margolis, HDGC Seminar, Oct. 16, 2002, page 42
Directions for Research • Need to improve our understanding of the mechanisms underlying the process of technological change • How do demand-pull and supply-push policies interact? • How much can we speed up the process of learning? • Can we quantify the value of R&D? R. M. Margolis, HDGC Seminar, Oct. 16, 2002, page 43