Download
1 / 1
10 likes | 125 Views
Mid-IR Spectroscopy of High Redshift Radio Galaxies J. I. Rawlings*, N. Seymour* and M. J. Page*. High Redshift Radio galaxies (HzRGs)

E N D
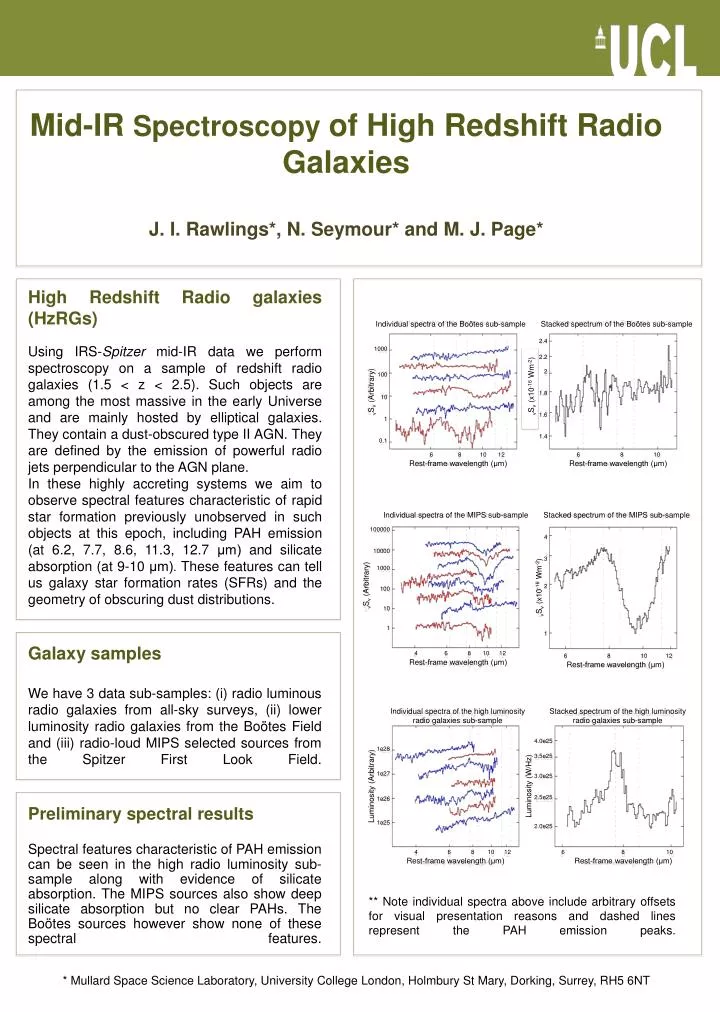
Mid-IR Spectroscopy of High Redshift Radio GalaxiesJ. I. Rawlings*, N. Seymour* and M. J. Page* High Redshift Radio galaxies (HzRGs) Using IRS-Spitzer mid-IR data we perform spectroscopy on a sample of redshift radio galaxies (1.5 < z < 2.5). Such objects are among the most massive in the early Universe and are mainly hosted by elliptical galaxies. They contain a dust-obscured type II AGN. They are defined by the emission of powerful radio jets perpendicular to the AGN plane. In these highly accreting systems we aim to observe spectral features characteristic of rapid star formation previously unobserved in such objects at this epoch, including PAH emission (at 6.2, 7.7, 8.6, 11.3, 12.7 μm) and silicate absorption (at 9-10 μm). These features can tell us galaxy star formation rates (SFRs) and the geometry of obscuring dust distributions. Individual spectra of the Boötes sub-sample Stacked spectrum of the Boötes sub-sample 2.4 2.2 2 1.8 1.6 1.4 1000 100 10 1 0.1 νSν (Arbitrary) νSν (x10-16 Wm-2) 6 8 10 12 6 8 10 Rest-frame wavelength (μm) Rest-frame wavelength (μm) Individual spectra of the MIPS sub-sample Stacked spectrum of the MIPS sub-sample 100000 10000 1000 100 10 1 4 3 2 1 νSν (x10-16 Wm-2) νSν (Arbitrary) Galaxy samples We have 3 data sub-samples: (i) radio luminous radio galaxies from all-sky surveys, (ii) lower luminosity radio galaxies from the Boötes Field and (iii) radio-loud MIPS selected sources from the Spitzer First Look Field. 4 6 8 10 12 6 8 10 12 Rest-frame wavelength (μm) Rest-frame wavelength (μm) Individual spectra of the high luminosity radio galaxies sub-sample Stacked spectrum of the high luminosity radio galaxies sub-sample 4.0e25 3.5e25 3.0e25 2.5e25 2.0e25 1e28 1e27 1e26 1e25 Luminosity (Arbitrary) Luminosity (W/Hz) Preliminary spectral results Spectral features characteristic of PAH emission can be seen in the high radio luminosity sub-sample along with evidence of silicate absorption. The MIPS sources also show deep silicate absorption but no clear PAHs. The Boötes sources however show none of these spectral features. 4 6 8 10 12 6 8 10 Rest-frame wavelength (μm) Rest-frame wavelength (μm) ** Note individual spectra above include arbitrary offsets for visual presentation reasons and dashed lines represent the PAH emission peaks. * Mullard Space Science Laboratory, University College London, Holmbury St Mary, Dorking, Surrey, RH5 6NT