Download
1 / 80
800 likes | 953 Views
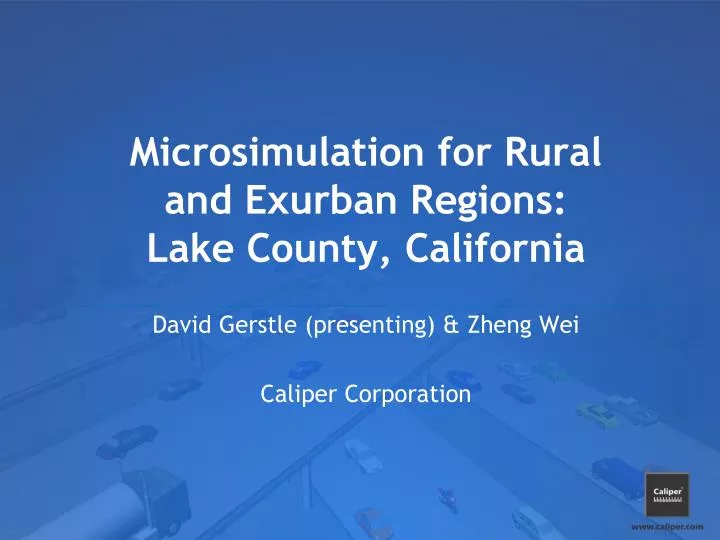
Microsimulation for Rural and Exurban Regions: Lake County, California. David Gerstle (presenting) & Zheng Wei Caliper Corporation. Executive Summary. Microsimulation is an important tool for modeling exurban and rural areas Congestion is often not an important driver of travel times

E N D
Microsimulation for Rural and Exurban Regions:Lake County, California David Gerstle (presenting) & ZhengWei Caliper Corporation
Executive Summary • Microsimulation is an important tool for modeling exurban and rural areas • Congestion is often not an important driver of travel times • “Minutia” such as grade, curvature, and lane widths are vitally important • Shown using a case-study of Lake County, California using Caliper’s TransModelermicrosimulation software: • Show how we calibrated & validated the model • Show failure to validate absent grade, curvature, lane widths, etc.
Outline • Project Background • Model Scope • Model Preparation • Model Minutia
Outline • Project Background • Model Scope • Model Preparation • Model Minutia
Project Background • Lake County Area Microsimulation Model (LAMM) • To develop a traffic simulation model that: • Supports planning and operational analysis • Focuses on SR-20, SR-53, and SR-29 and the communities surrounding Clear Lake • Extends and complements existing models and modeling activities • To evaluate future-year scenarios
Project Background • Lake County Area Microsimulation Model (LAMM) • To develop a traffic simulation model that: • Supports planning and operational analysis • Focuses on SR-20, SR-53, and SR-29 and the communities surrounding Clear Lake • Extends and complements existing models and modeling activities • To evaluate future-year scenarios
Lake County • Approx. 2 hr. drive from SFO to southern Lake County
Lake County Lake County
Project Background • Lake County Area Microsimulation Model (LAMM) • To develop a traffic simulation model that: • Supports planning and operational analysis • Focuses on SR-20, SR-53, and SR-29 and the communities surrounding Clear Lake • Extends and complements existing models and modeling activities • To evaluate future-year scenarios
Dominant route for through traffic passes through populated areas
Outline • Project Background • Model Scope • Model Preparation • Model Minutia
Outline • Project Background • Model Scope • Geography • Time Periods & Vehicle Population • Model Preparation • Model Minutia
Lake County Study Area
Lake County • 450 square miles of Lake County, from Middletown (Napa border) to Upper Lake (Mendocino border) Study Area
Lake County Level of Detail
Lake County • 720 miles of roadway (120 miles on State Routes) • 4,200 Links and 3,300 Nodes • All roads in the regional travel demand model are included Level of Detail
Lake County Nice • High level of detail for local streets Level of Detail
Lake County • Intersection geometry accurately reproduced Level of Detail
Outline • Project Background • Model Scope • Geography • Time Periods & Vehicle Population • Model Preparation • Model Minutia
Time Periods & Vehicle Population • Times of day include two peak periods • 6:00 – 9:00 AM • 3:00 – 6:00 PM • Vehicle Population • Auto • Truck
Time Periods & Vehicle Population • Times of day include two peak periods • 6:00 – 9:00 AM • 3:00 – 6:00 PM • Vehicle Population • Auto • Truck
Outline • Project Background • Model Scope • Model Preparation • Data Collection • Model Calibration • Model Validation • Model Minutia
Outline • Project Background • Model Scope • Model Preparation • Data Collection • Model Calibration • Model Validation • Model Minutia
Data Collection • GPS-recorded travel times • O-D surveys • Turning movement counts • Directional counts
Data Collection GPS Travel Times O-D Survey Sites (5) Turning Movement (20) Directional Counts (26)
Data Collection GPS Travel Times O-D Survey Sites (5) Turning Movement (20) Directional Counts (26)
Data Collection GPS Travel Times O-D Survey Sites (5) Turning Movement (20) Directional Counts (26)
Data Collection GPS Travel Times O-D Survey Sites (5) Turning Movement (20) Directional Counts (26)
Outline • Project Background • Model Scope • Model Preparation • Data Collection • Model Calibration • Model Validation • Model Minutia
Model Calibration • Take the calibrated travel demand model as the starting point • Iteratively cycle between • Trying to match turn & directional counts • Trying to equilibrate route choices • Target traffic count calibration standards set by Caltrans
Model Calibration Calibrated Travel Demand Model • Take the calibrated travel demand model as the starting point • Iteratively cycle between • Trying to match turn & directional counts • Trying to equilibrate route choices • Target traffic count calibration standards set by Caltrans Match Counts (ODME) Match Times (DTA) Calibrated Micro-simulation Model
Model Calibration • Take the calibrated travel demand model as the starting point • Iteratively cycle between • Trying to match turn & directional counts • Trying to equilibrate route choices • Target traffic count calibration standards set by Caltrans
Outline • Project Background • Model Scope • Model Preparation • Data Collection • Model Calibration • Model Validation • Model Minutia
Model Validation • Take the calibrated traffic simulation model as the starting point • Iteratively cycle between • Trying to match point-to-point travel times • Reviewing/revisiting model development and calibration steps • Target travel time calibration standards set by Caltrans
Model Validation Calibrated Traffic Simulation Model • Take the calibrated traffic simulation model as the starting point • Iteratively cycle between • Trying to match point-to-point travel times • Reviewing/revisiting model development and calibration steps • Target travel time calibration standards set by Caltrans Revisit Calibration (ODME/DTA) Match Times (Simulation) Validated Micro-simulation Model
Model Validation Point-to-Point Travel Times Boundary Upper Lake Lucerne SR-53 Kelseyville Lower Lake Middletown
Model Validation AM Southbound Travel Times GPS: 6.63 min TSM: 6.82 min : 2.9% GPS: 15.95 min TSM: 15.89 min : 0.36% Boundary GPS: 13.35 min TSM: 15.03 min : 11.82% Upper Lake Lucerne SR-53 GPS: 15.92 min TSM: 16.17 min : 1.61% Kelseyville GPS: 11.29 min TSM: 8.95 min : 23.07% GPS: 16.92 min TSM: 17.79 min : 5.01% Lower Lake GPS: 20.25 min TSM: 21.63 min : 6.85% Middletown
Model Validation AM Northbound Travel Times GPS: 6.48 min TSM: 6.97 min :7.21% GPS:15.65 min TSM: 16.53 min :5.49% Boundary GPS: 13.87 min TSM: 14.87 min :6.99% Upper Lake Lucerne SR-53 GPS: 15.22 min TSM: 16.56 min : 10.56% Kelseyville GPS: 13.12 min TSM: 8.93 min :37.98% GPS: 17.52min TSM: 18.21 min : 3.84% Lower Lake GPS: 20.53 min TSM: 21.86 min :6.31% Middletown
Model Validation PM Southbound Travel Times GPS: 6.24 min TSM: 6.96 min :10.92% GPS: 15.58 min TSM: 16.38 min : 5.01% Boundary GPS: 13.51 min TSM: 15.34 min :12.73% Upper Lake Lucerne SR-53 GPS: 16.03 min TSM: 16.61 min :3.56% Kelseyville GPS: 10.66 min TSM: 9.30min :13.64% GPS: 16.86min TSM: 17.95 min :6.26% Lower Lake GPS: 20.52 min TSM: 21.62 min :5.21% Middletown
Model Validation PM Northbound Travel Times GPS: 6.55 min TSM: 6.99 min : 6.45% GPS: 15.02 min TSM: 16.58 min :9.88% Boundary GPS: 13.12 min TSM: 15.03 min :13.53% Upper Lake Lucerne SR-53 GPS: 17.31 min TSM: 16.54 min : 4.57% Kelseyville GPS: 10.14 min TSM: 9.21 min :9.60% GPS: 16.82 min TSM: 18.55 min :9.81% Lower Lake GPS: 19.96 min TSM: 22.42 min :11.60% Middletown
Model Validation Lower and Upper Bounds calculated by bootstrapping sample
Model Validation Create bootstrapped sample of the set of simulation runs For each run in bootstrapped sample, create bootstrapped sample of point-to-point travel times Calculate expected travel time for each simulation run Lower and Upper Bounds calculated by bootstrapping sample
Model Validation Which is to say this is NOT an average of all of the point-to-point travel times Create bootstrapped sample of the set of simulation runs For each run in bootstrapped sample, create bootstrapped sample of point-to-point travel times Calculate expected travel time for each simulation run Lower and Upper Bounds calculated by bootstrapping sample
Outline • Project Background • Model Scope • Model Preparation • Model Minutia • Curvature • Grade • Lane Width • Two-lane Highway Passing
Outline • Project Background • Model Scope • Model Preparation • Model Minutia • Curvature • Grade • Lane Width • Two-lane Highway Passing