Download
1 / 47
470 likes | 548 Views
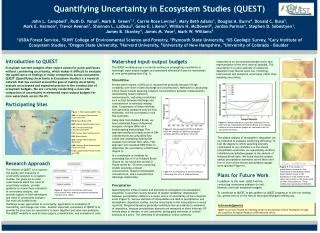
Estimating Uncertainty in Ecosystem Budgets. Ruth Yanai, SUNY-ESF, Syracuse Ed Rastetter, Ecosystems Center, MBL Dusty Wood, SUNY-ESF, Syracuse. Ecosystem Budgets have No Error. Hubbard Brook P Budget Yanai (1992) Biogeochemistry. Replicate Measurements.

E N D
Estimating Uncertainty in Ecosystem Budgets Ruth Yanai, SUNY-ESF, Syracuse Ed Rastetter, Ecosystems Center, MBL Dusty Wood, SUNY-ESF, Syracuse
Ecosystem Budgets have No Error Hubbard Brook P Budget Yanai (1992) Biogeochemistry
How can we estimate the uncertainty in ecosystem budget calculations from the uncertainty in the component measurements? Try it with biomass N in Hubbard Brook Watershed 6.
When adding, the variance of the total (T) is the sum of the variances of the addends (x): For independent errors. If they’re correlated, use the sum of covariances. Mathematical Error Propagation
Mathematical Error Propagation When adding, the variance of the total (T) is the sum of the variances of the addends (x): Biomass N content = wood N content + bark N content + branch N content + foliar N content + twig N content + root N content
Mathematical Error Propagation When adding, the variance of the total (T) is the sum of the variances of the addends (x): Biomass N content = wood mass · wood N concentration + bark mass · bark N concentration + branch mass · branch N concentration + foliar mass · foliar N concentration + twig mass · twig N concentration + root mass · root N concentration
Mathematical Error Propagation When multiplying, variance of the product is the product of the means times the sum of the variance of the factors:
Mathematical Error Propagation When multiplying, variance of the product is the product of the means times the sum of the variance of the factors: wood mass · wood N concentration But • log (Mass) = a + b*log(PV) + error • And • PV = 1/2 r2 * Height • log(Height) = a + b*log(Diameter) + error
Mathematical Error Propagation “The problem of confidence limits for treatment of forest samples by logarithmic regression is unsolved.” --Whittaker et al. (1974)
Monte Carlo Simulation Tree Height • log (Height) = a + b*log(Diameter) + error
Monte Carlo Simulation Tissue Mass • log (Mass) = a + b*log(PV) + error • PV = 1/2 r2 * Height
Monte Carlo Simulation Tissue Concentration • N concentration = constant + error
Monte Carlo Simulation Calculate the nutrient contents of wood, branches, twigs, leaves and roots, using species- and element-specific parameters, sampling these parameters with known error. After many iterations, analyze the variance of the results.
A Monte-Carlo approach could be implemented using specialized software or almost any programming language. This illustration uses a spreadsheet model.
Lookup Lookup Lookup Height Parameters ***IMPORTANT*** Random selection of parameters values happens HERE, not separately for each tree • Height = 10^(a + b*log(Diameter) + log(E))
Biomass Parameters Lookup Lookup Lookup • Biomass = 10^(a + b*log(PV) + log(E)) • PV = 1/2 r2 * Height
Biomass Parameters Lookup Lookup Lookup • Biomass = 10^(a + b*log(PV) + log(E)) • PV = 1/2 r2 * Height
Biomass Parameters Lookup Lookup Lookup • Biomass = 10^(a + b*log(PV) + log(E)) • PV = 1/2 r2 * Height
Concentration Parameters Lookup Lookup • Concentration = constant + error
Paste Values button After enough interations, analyze your results
Repeated Calculations of N in Biomass Hubbard Brook Watershed 6 How many iterations is enough?
Repeated Calculations of N in Biomass Hubbard Brook Watershed 6 Two different sets of 250 iterations: Mean settles down over many iterations
Repeated Calculations of N in Biomass Hubbard Brook Watershed 6 Uncertainty in Biomass N: 110 kg/ha Coefficient of Variation: 18%
Hubbard Brook W6 is surveyed in 208 25m x 25m plots. How much variation is there from one part of this watershed to another? This is a more common way to represent uncertainty in budgets. Approaches to Estimating Uncertainty: Replicate Measurements
Replicate Samples Variation across plots: 16 Mg/ha, or 5%
Replicate Samples Variance across plots: 30 Mg/ha, or 10% with smaller plots
Which is More Uncertain? Parameter uncertainty doesn’t affect comparisons across space. But it matters when you take your number and go.
The Value of Ecosystem Error • Quantify uncertainty in our results
The N budget for Hubbard Brook published in 1977 was “missing” 14.2 kg/ha/yr Borrmann et al. (1977) Science
Net N fixation (14.2 kg/ha/yr) = • hydrologic export • + N accretion in the forest floor • + N accretion in mineral soil • + N accretion in living biomass • precipitation N input • weathering N input • change in soil N stores
We can’t detect a difference of 1000 kg N/ha in the mineral soil…
The Value of Ecosystem Error • Quantify uncertainty in our results Identify ways to reduce uncertainty
Better than the sensitivity estimates that vary everything by the same amount--they don’t all vary by the same amount! “What is the greatest source of uncertainty in my answer?”
“What is the greatest source of uncertainty to my answer?” Better than the uncertainty in the parameter estimates--we can tolerate a large uncertainty in an unimportant parameter.
Other Considerations Independence of error (covariance) Distribution of errors (normal or not)
Additional Sources of Error Bias in measurements Errors of omission Conceptual errors Measurement errors Spatial and temporal variation
The Value of Ecosystem Error • Quantify uncertainty in our results Identify ways to reduce uncertainty Advice • One way or another, find a way to calculate ecosystem errors, and report them. • This is not possible unless researchers also report error with parameters.