Download
1 / 9
90 likes | 186 Views
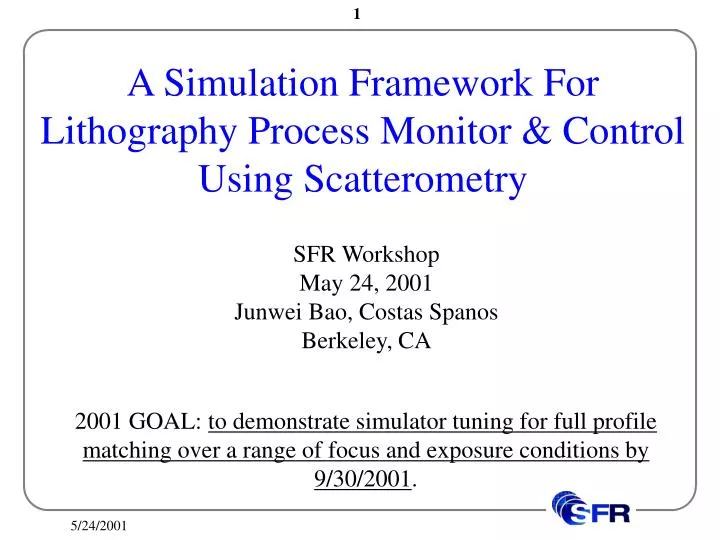
A Simulation Framework For Lithography Process Monitor & Control Using Scatterometry. SFR Workshop May 24, 2001 Junwei Bao, Costas Spanos Berkeley, CA. 2001 GOAL: to demonstrate simulator tuning for full profile matching over a range of focus and exposure conditions by 9/30/2001. Motivation.

E N D
A Simulation Framework For Lithography Process Monitor & Control Using Scatterometry SFR Workshop May 24, 2001 Junwei Bao, Costas Spanos Berkeley, CA 2001 GOAL: to demonstrate simulator tuning for full profile matching over a range of focus and exposure conditions by 9/30/2001.
Motivation • Lithography process parameter drift is one of the major sources of CD variation. • Sub-0.25mm patterning has greatly reduced the depth of focus. This makes the printed profile sensitive to the focus drift. • Due to requirements of later process steps, a tight control of sidewall angle is needed, so it is not feasible to compensate the focus drift by just adjusting the exposure. • Scatterometry has been proven to be a promising candidate as an in-situ, full-profile metrology tool for advanced process monitoring and control.
Noise Noise The Lithography Control Framework Using Scatterometry Control parameter Patterned wafer Lithography module Ellipsometer +/- Adjusted offset Measured spectrum Feedback controller Measured profile Scatterometry library Control param. extractor Extracted control parameters
Noise The Simulation Framework For Process Control Using Scatterometry Control parameter Patterned wafer Prolith process simulator Grating response simulator +/- +/- Adjusted offset Measured spectrum Feedback controller Measured profile Scatterometry library Control param. extractor Extracted control parameters
Structure, Profiles and Spectrum: Process Simulation and Scatter Predictions match well 480 nm 160 nm Resist 505 nm ARC 61 nm
Parameter Disturbance Emulating Process Drift First order integrated moving average disturbance model ( = 0.3)
Extracted vs. Input Focus and Exposure Settings: Full Profile Extraction detects process inputs Standard deviation of detection error: 0.025 m (focus), 0.23 mJ/cm2 (exposure)
Conclusions and Future Work Both focus and exposure drifts can be monitored with scatterometry. CD and sidewall angle variations are reduced by feedback control of focus and exposure according to simulation. Next Goals: Study the effect of disturbance model and controller parameters on control results. Study the case of multi-wafer delay between metrology and control. Demonstrate lithography simulator tuning for full statistical profile matching over a range of conditions, by 9/30/2002. Implement lithography controller that merges full profile in-line information with available metrology, by 9/30/2003.