Download
1 / 41
410 likes | 434 Views
Explore the quantified costs and benefits of policy choices in Public Health, Transportation, and the Built Environment. This study examines the relationship between land use, travel behavior, and health outcomes with a focus on obesity and sedentary activity. Assess the impact of suburban growth, food availability, and lifestyle on obesity rates. Discover the effectiveness of projects like California Safe Routes to School in promoting physical activity and reducing health risks associated with sedentary lifestyles. Analyze data related to transportation, urban design, and parental perceptions of land use interventions aimed at improving public health outcomes.

E N D
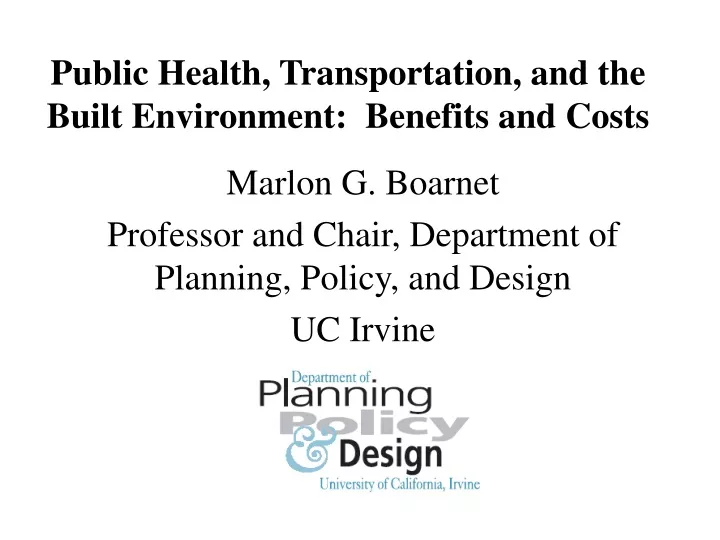
Public Health, Transportation, and the Built Environment: Benefits and Costs Marlon G. Boarnet Professor and Chair, Department of Planning, Policy, and Design UC Irvine
Benefits and Costs of Health, Travel, and Built Environment An Odd Question: • Are there specific well understood policy choices with quantified costs and benefits to analyze? • Is this a common question in earlier land use – transportation literature or practice? • Are there data that allow quantifying health benefits?
Background: Health, Land Use, and Travel Behavior • Motivation: Obesity and Sedentary Activity • 400,000 deaths per year in U.S. due to diseases linked to physical inactivity or diet • 435,000 deaths per year in U.S. due to smoking
No Data <10% 10%–14% Obesity Trends* Among U.S. AdultsBRFSS, 1988 (*BMI ≥30, or ~ 30 lbs overweight for 5’ 4” person)
No Data <10% 10%–14% Obesity Trends* Among U.S. AdultsBRFSS, 1989 (*BMI ≥30, or ~ 30 lbs overweight for 5’ 4” person)
No Data <10% 10%–14% Obesity Trends* Among U.S. AdultsBRFSS, 1990 (*BMI ≥30, or ~ 30 lbs overweight for 5’ 4” person)
No Data <10% 10%–14% 15%–19% Obesity Trends* Among U.S. AdultsBRFSS, 1991 (*BMI ≥30, or ~ 30 lbs overweight for 5’ 4” person)
No Data <10% 10%–14% 15%–19% Obesity Trends* Among U.S. AdultsBRFSS, 1992 (*BMI ≥30, or ~ 30 lbs overweight for 5’ 4” person)
No Data <10% 10%–14% 15%–19% Obesity Trends* Among U.S. AdultsBRFSS, 1993 (*BMI ≥30, or ~ 30 lbs overweight for 5’ 4” person)
No Data <10% 10%–14% 15%–19% Obesity Trends* Among U.S. AdultsBRFSS, 1994 (*BMI ≥30, or ~ 30 lbs overweight for 5’ 4” person)
No Data <10% 10%–14% 15%–19% Obesity Trends* Among U.S. AdultsBRFSS, 1995 (*BMI ≥30, or ~ 30 lbs overweight for 5’ 4” person)
No Data <10% 10%–14% 15%–19% Obesity Trends* Among U.S. AdultsBRFSS, 1996 (*BMI ≥30, or ~ 30 lbs overweight for 5’ 4” person)
No Data <10% 10%–14% 15%–19% ≥20 Obesity Trends* Among U.S. AdultsBRFSS, 1997 (*BMI ≥30, or ~ 30 lbs overweight for 5’ 4” person)
No Data <10% 10%–14% 15%–19% ≥20 Obesity Trends* Among U.S. AdultsBRFSS, 1998 (*BMI ≥30, or ~ 30 lbs overweight for 5’ 4” person)
No Data <10% 10%–14% 15%–19% ≥20 Obesity Trends* Among U.S. AdultsBRFSS, 1999 (*BMI ≥30, or ~ 30 lbs overweight for 5’ 4” person)
No Data <10% 10%–14% 15%–19% ≥20 Obesity Trends* Among U.S. AdultsBRFSS, 2000 (*BMI ≥30, or ~ 30 lbs overweight for 5’ 4” person)
Obesity Trends* Among U.S. AdultsBRFSS, 2001 (*BMI ≥30, or ~ 30 lbs overweight for 5’ 4” person) No Data <10% 10%–14% 15%–19% 20%–24% ≥25%
Obesity Trends* Among U.S. AdultsBRFSS, 2002 (*BMI ≥30, or ~ 30 lbs overweight for 5’ 4” person) (*BMI 30, or ~ 30 lbs overweight for 5’4” person) No Data <10% 10%–14% 15%–19% 20%–24% ≥25%
Obesity* Trends Among U.S. AdultsBRFSS, 2003 (*BMI ≥30, or ~ 30 lbs overweight for 5’ 4” person) No Data <10% 10%–14% 15%–19% 20%–24% ≥25%
Do the Suburbs Make you Fat? • Obesity epidemic occurred in the last generation Percent of U.S. Adult Population Obese: • Late 1970’s: 15% • 1999, 27% Source: U.S. Dept. of Health and Human Services • Peak Suburban Growth from late 1940’s through 1970’s
Land Use, Travel, and Health • Is land use planning part of the problem? Food processing, food availability, diet, lifestyle • Can land use planning be part of the solution? Among 8,042 persons, 1,949 (24%) had at least one walking trip during two-day period. Median distance of a walk trip = 0.54 miles 25% of walking trips < 0.31 miles 25% of walking trips > 0.97 miles
Costs and Benefits of Land Use, Travel, and Health • Large benefits for a few people Mobility: small benefits for large numbers of persons Move 100 persons from 16 to 48 minutes of PA per year discounted benefits = $5.2 to $15.86 million • Projects can be inexpensive
California Safe Routes to School • Authorized by California AB 1475, 1999 • Renewed by SB10, 2001 • As of Fall, 2003, 3 cycles of projects funded • Over 270 projects funded • $66 million in federal funds allocated • State match capped at $250,000 per project
Safe Routes to School Evaluation • 10 elementary school sites studied • Before/After evaluation • Traffic characteristics • Vehicle counts, vehicle speed, yield to non-motorized traffic, walk/bicycling counts and on sidewalk/street • Urban Design • Survey of parents of 3rd-5th grade children • Did child walk more after SR2S construction?
Star indicates location of elementary school; Circle represents portion of neighborhood included in the study (approx. ¼ mile radius from the elementary school) Sort by Whether SR2S Project Along Route to School • Survey asked if project was along child’s usual route to school • 52% of parents said “yes”; 48% said “no”
After Construction Data • 1244 returned “after construction” surveys from 10 schools • School response rates varied from 23% to 54% • Full Sample Response Rate: 40%
SR2S on Planning’s Terms • Small (approx. $250,000) projects can increase the likelihood of children walking to school • Physical activity may increase • But these projects were sound planning anyways – the health link can allow us to better understand planning
Sheldon Elementary: Average Vehicle Speeds on San Pablo Dam Road
Sheldon: Safety Advantage from Shift of Walking to Sidewalk San Pablo Dam Road after sidewalk improvement San Pablo Dam Road before sidewalk improvement
Other Results • Frank, et al. study of walking in Seattle neighborhoods • 8.8 additional minutes of walking associated with: • Increase from 52.28 to 62.74 intersections per square kilometer • Increase residential density from 3.63 to 4.36 du per acre • Increase in the mixed use index from 0.31 to 0.37 • Increase in retail floor area ratio from 0.25 to 0.30
Montara Elementary School, South Gate, approximately 66 intersections per sq. km.
Back Bay, Newport Beach/Costa Mesa, approximately 47 intersections per sq. km.
West Los Angeles, approximately 70 intersections per sq. km.
Conclusion • Changes associated with increased walking are within range of development experience • Low-cost projects can have impacts • Basic infrastructure – sidewalks, street crossings, public spaces • Elements of neighborhood design