Download
1 / 22
220 likes | 232 Views
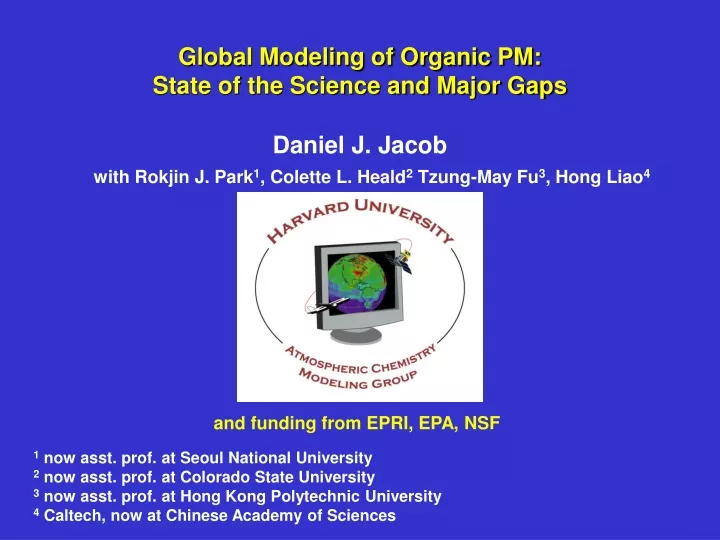
This article discusses the current state of organic PM modeling, identifies major gaps in knowledge, and explores the sources and formation of organic PM. Funding is provided by EPRI, EPA, and NSF.

E N D
Global Modeling of Organic PM: State of the Science and Major Gaps Daniel J. Jacob with Rokjin J. Park1, Colette L. Heald2 Tzung-May Fu3, Hong Liao4 and funding from EPRI, EPA, NSF 1 now asst. prof. at Seoul National University 2 now asst. prof. at Colorado State University 3 now asst. prof. at Hong Kong Polytechnic University 4 Caltech, now at Chinese Academy of Sciences
ORGANIC PM IN STANDARD GEOS-Chem MODEL Global sources in Tg C y-1 20 K OH, O3,NO3 SOG SOA VOC secondary formation POA isoprene terpenes oxygenates… alkanes alkenes aromatics… alkenes aromatics oxygenates… 20 100 30 700 50 vegetation fuel/industry open fires fuel/industry open fires VOC EMISSION PRIMARY EMISSION
IMPROVE obs (1998) U.S. source: 3.1 Tg yr-1 0.52 1.10 0.89 0.60 TOP-DOWN CONSTRAINTS ON U.S. SOURCES Fit GEOS-Chem sources of organic PM to monthly 1998 data at IMPROVE sites annual Park et al. [JGR 2003]
IMPROVED MODEL WITH 1ox1o RESOLUTION,SOA FORMATION BY PANKOW/SEINFELD MECHANISM IMPROVE (2001, annual) Park et al. [AE 2006] mg m-3
SENSITIVITY OF NATURAL OC PM CONCENTRATIONSTO PRE-EXISTING POA AVAILABILITY Is SOA formation limited by availability of primaryorganic aerosol (POA)? YES NO Major implications for natural visibility objective of the Regional Haze Rule Park et al. [AE 2006]
QUANTIFYING THE BIOMASS BURNING SOURCE OF PM2.5 FROM CORRELATION OF TOTAL CARBON (TC) WITH NON-SOIL K+AT IMPROVE SITES Non-soil K+: West: summer max, low background East: winter and summer maxes, high background use TC vs. ns-K+ linear regression together w/satellite data to quantify TC from open fires Background ns-K+ (traces industrial biofuel) d[TC]/d[ns-K+] Park et al. [AE 2007]
FIRE AND BIOFUEL CONTRIBUTIONS TO TC PM2.5 Annual mean C concentrations, 2001-2004 Mean values for W and E at top of plot Park et al. [AE 2007]
IMPLICATIONS FOR AQ STANDARDS AND EMISSION INVENTORIES Emissions for contiguous U.S. (climatological estimate for fires) Source attribution at IMPROVE sites (annual means) Park et al. [AE 2007]
Observed (Huebert) GEOS-Chem (Chung & Seinfeld for SOA) ACE-Asia aircraft data over Japan (April-May 2001) Observed (Russell) FIRST MASS CONCENTRATION MEASUREMENTSOF OC AEROSOLS IN FREE TROPOSPHERE Chung and Seinfeld scheme: OC/sulfate ratio • Observations show 1-3 mg m-3 background; • model too low by factor 10-100 Heald et al. [GRL 2005]
LITTLE TRANSPACIFIC INFLUENCE OF ASIAN ORGANIC PMON U.S. SURFACE AIR Spring 2001 IMPROVE sulfate data Mean PM concentrations observed in NW U.S. (mg m-3) Days of max Asian influence (diagnosed by GEOS-Chem) Other studies (Randall Martin, Rodney Weber) find no OC enhancement in transpacific Asian plumes sampled from aircraft [Heald et al., JGR 2006a]
ITCT-2K4 AIRCRAFT CAMPAIGN OVER EASTERN U.S. IN JULY-AUGUST 2004 water-soluble organic carbon (WSOC) aerosol measurements by Rodney J. Weber (Georgia Tech) Alaska fire plumes 2-6 km altitude Heald et al. [JGR 2006b] Values ~2x lower than observed in ACE-Asia; excluding fire plumes gives mean of 1.0 mgC m-3 (3x lower than ACE-Asia)
~10% yield ~2% yield MODEL OC AEROSOL SOURCES DURING ITCT-2K4 Large fires in Alaska and NW Canada: 60% of fire emissions released above 2 km (pyro-convection) Heald et al., [JGR 2006b]
ITCT-2K4 OC AEROSOL: VERTICAL PROFILES Total Biomass burning Anthropogenic Biogenic SOA Observations Model hydro- phobic SOx = SO2 + SO42-: efficient scavenging during boundary layer ventilation Data filtered against fire plumes (solid) and unfiltered (dotted) Model source attribution Heald et al. [JGR 2006b]
IRREVERSIBLE DICARBONYL UPTAKE BY AQUEOUS AEROSOL glyoxal methylglyoxal Chamber AMS experiments of glyoxal uptake by Liggio et al. [JGR 2005] Organic aerosol mass growth with time Inferred reactive uptake coefficient g • median g = 2.9x10⁻³ observed for aqueous surfaces; evidence for oligomerization • similar g observed for methylglyoxal on acidic surfaces [Zhao et al. ES&T 2006]
POSSIBLE MECHANISMS FOR DICARBONYL SOA FORMATION GAS AQUEOUS Schweitzer et al. [1998] Kalberer et al. [2004] Liggio et al. [2005a,b] Hastings et al. [2005] Zhao et al. [2006] Loeffler et al. [2006] glyoxal Oligomers oligomerization oligomerization H* ~ 105 M atm-1 Altieri et al. [2006, 2008] oxidation methylglyoxal OH Organic acids Ervens et al. [2004] Crahan et al. [2004] Lim et al. [2005] Carlton et al. [2006, 2007] Warneck et al. [2005] Sorooshian et al. [2006, 2007] H* ~ 103 M atm-1
GLYOXAL/METHYLGLYOXAL FORMATION FROM ISOPRENE 6% 25% GEOS-Chem mechanism based on MCM v3.1 Fu et al. [JGR, in press] molar yields
Including reactive uptake by aq. aerosols + clouds with g =2.9x10⁻³ [Liggio et al., 2005] GLOBAL GLYOXAL BUDGET IN GEOS-Chem (biomass burning) t = 2.9 h Global SOA formation of 6.4 Tg yr-1 (1.0 in clear sky + 5.4 in cloud); compare to 16 Tg yr-1 from terpenes/isoprene by semivolatile mechanism Fu et al. [JGR, in press]
GLOBAL METHYLGLYOXAL BUDGET IN GEOS-Chem Including reactive uptake by aerosols and clouds with g =2.9x10⁻³ (biomass burning) t = 1.6 h Global SOA formation of 16 Tg yr-1 (2 in clear sky + 14 in cloud); compare to 16 Tg yr-1 from terpenes/isoprene by semivolatile mechanism Fu et al. [JGR, in press]
MODEL COMPARISON TO IN SITU OBSERVATIONS Continental boundary layer (all northern midlatitudes summer) Continental free troposphere Marine boundary layer Glyoxal Methylglyoxal Indication of a missing marine source in the model Fu et al. [JGR, in press]
SCIAMACHY SATELLITE OBSERVATION OF GLYOXAL • General spatial pattern reproduced over land, SCIAMACHY is 50% higher than model • SCIAMACHY sees high values over oceans correlated with chlorophyll: unidentified marine source? 100 pptv glyoxal in marine boundary layer would yield ~1 mg C m-3 SOA; could contribute to observed OC aerosol concentrations in marine air Fu et al. [JGR, in press]
SIMULATION OF WSOC AEROSOL OVER EASTERN U.S. IMPROVE (surface) ICARTT model w/ dicarbonyls w/out dicarbonyls Water-soluble OC (WSOC) aerosol observations by Rodney Weber (GIT) from NOAA aircraft during ICARTT campaign out of Portsmouth, NH (Jul-Aug 04) Boundary layer data (<2 km) biomass burning plumes excluded Observed Model w/ dicarbonyl SOA added Model w/ standard SOA Model hydrophilic primary OA Dicarbonyl source in summer is mainly Biogenic (isoprene) Fu et al., in prep.
CORRELATIONS OF FREE TROPOSPHERIC WSOC WITH OTHER VARIABLES MEASURED ON NOAA AIRCRAFT Observed Model with dicarbonyl SOA Model without dicarbonyl SOA • WSOC is observed to correlate with • toluene and methanol (anthro+bio?) • sulfate (aqueous-phase production?) • alkyl nitrates (photochemistry?) • Model does not reproduce observed WSOC variability but does better with correlations, particularly when dicarbonyl SOA is included (sulfate, alkyl nitrates) Fu et al., in prep.