Download

1 / 26
260 likes | 367 Views
Image retrieval and categorization. Janez Brank, IJS. Introduction. Collections of images (a.k.a. pictorial databases) Proprietary collections: archives, libraries The Web as a source of images (Google: 320 M) Problems in handling such databases Storing, manipulating large amounts of data

E N D
Image retrievaland categorization Janez Brank, IJS
Introduction • Collections of images(a.k.a. pictorial databases) • Proprietary collections: archives, libraries • The Web as a source of images (Google: 320 M) • Problems in handling such databases • Storing, manipulating large amounts of data • Image retrieval • Image categorization
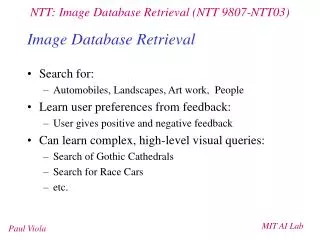
Image retrieval • The user poses a query or question, specifying what sort of images he/she is interested in • The system should retrieve the most interesting or relevant images
Image retrieval • Problems: • How to describe a query? • Textual descriptions • Query by content or appearance • How to represent images? • How to decide how relevant an image is with regard to a query?
Textual descriptions • A few keywords or sentences are associated with each image • Related idea: structured or semistructured data, semantic frames, etc. • The user requests images with a particular set of keywords • Relatively simple and efficient from a technical point of view
Problems with textual descriptions • Preparing and maintaining the descriptions • The users and the maintainers have to share a common vocabulary • Ambiguities... Tiger, an Araucana rooster(#2 on AV) Henri Rousseau: Combat of a Tiger and a Buffalo, 1909 (#5 on AV) Toru“Tiger”Okoshi(#1 on Google) “A photo ofour CEO”, tigertronics.com(#3 on Google) Yolo County, CA, TIGER map service, U.S. Census Bureau (#4 on Google) Tiger Woods (#1 on AV)
Automatic keyword preparation • Sources of keywords when imageshave been extracted from a web page: • The URL and filename • The alt attribute <img alt="..." ...> • Other words from the web page, its title, description (meta tags), etc.
Content-based image retrieval • The user shows an image of the sort he or she is interested in (the “query image”) • Or draws a sketch of the image(s) of interest • The system retrieves images similar in appearance to the query image • Image representation • Related issues: color spaces, segmentation,... • Similarity measure / distance measure
Content-based image retrieval • Benefits: • Fully automatic (amount of effort not proportional to number of images) • Great when we are suddenly faced with a large set of new images • Not limited by the expressive power of words (or their ambiguity)
Content-based image retrieval • Disadvantages: • More demanding with regard to CPU time, memory, disk space, etc. • Descriptions of images likely to be longer • Only captures some aspects of similarity, missing others and introducing false hits • Only suitable for some collections of images(e.g., diversity of colors and color distributions helps a lot)
Combined approaches • Chabot: • An existing (large) database of photographies, each described with a few attributes from a relational database • A few keywords, date, location, photographer, ... • Extract simple symbolic information: • How much of the image is covered by a particular color (13 basic colors)? • Specks or dots of one color surrounded by different colors • A string description, e.g. "mostly green,some red dots", augments other attributesand can be used in querying
Pixels and color spaces • The image is atwo-dimensional gridof square tilescalled pixels • Each pixel hasa uniform color • All colors that pixels may have form acolor space
Color spaces • RGB: each color is a sum of ared, green, and blue component • The intensity of each componentis given by a number from [0, 1] • The color is a triple (r, g, b)from the unit cube • HSV: hue, saturation (0 = gray,1 = most vivid), value (or brightness:0 = black, 1 = bright) • We can imagine thisspace as a cone
Perceptual uniformity • This is very far from true for RGB and HSV • Other color spaces (e.g. Lab, Luv) and other distance measures (e.g. CMC) have been defined to improve perceptual uniformity are represented by Colors Points (in the 3-d color space) shouldcorrespond to Perceived difference/similarity between colors Distance (e.g. Euclidean) between points
Color space quantization • Divide the color space into some number (e.g. N) of disjoint regions • Represent each color by the index of the region it belongs to • A simple way of recognizing similar colors as similar (i.e. by pretending they are the same) • But colors from two different (adjacent) regions can still be fairly similar, which we would tend to ignore • As if the image had been painted using a palette of N colors • Example: divide each coordinate axis of the RGB cube into 6 ranges 666 = 216 palette entries
Histograms (g1, g2) DE |h2—g2| (h1, h2) |h1—g1| • Choose a color space and a quantization • For each region of the color space, record what proportion of pixels belong to that region • We get N numbers (an N-dimensional vector) (h1, . . . , hN) • Distance between histograms gives us a notion of difference between images: • Euclidean: DE2 = (h1—g1)2 + (h2—g2)2 + . . . + (hN—gN)2 • Manhattan: DM = |h1—g1| + |h2—g2| + . . . + |hN—gN| • Remarkably useful given their simplicity • Only capture information about the presence of a color, but ignore its spatial distribution
Segmentation • A single description (e.g. a histogram) of the entire image can be very inaccurate • Divide the image into several regions such that the color or texture of each region is approximately uniform • How to describe each region? • How to measure similarity between regions? • How to combine information about similarity between regions into a similarity measure between images?
Segmentationas filtering • Texture is usually defined as a pattern that repeats itself regularly in the image • One can use digital filters to work with texture in the frequency space • Or, use edge detection to defineborders between regions
Segmentation as clustering described by • Divide the image into a grid of small windows (e.g. 44 pixels) • Describe each window with a vector (e.g. average color, etc.) • If two vectors lie close together, their corresponding windows are probably similar • Use clustering to form groups of adjacent vectors (hopefully representing similar windows) • Form a region from the windows of each cluster. Use the centroid of the cluster to describe the region. windows vectors merge to form (clus tering) define how clusters described by regions centroids (average of all vec-tors in a cluster)
Similarity measures • Each region described by a vector • Use Euclidean distance between vectors as distance between regions • Define the distance between images as a weighted sum of distances between all pairs of regions • Limit the influence of individual regions by limiting the total weight associated with them • When assigning weights, pairs of more similar regions have priority
Image retrieval in practice • Several search engines provideimage search • AltaVista, Google, FAST(images from the web) • Always based on keywords(AltaVista used to offer similarity search) • Proprietary collections, e.g. Corbis, Lycos (PicturesNOW) • Demonstrations of research systems,e.g. SIMPLIcity...
Image categorization • We define a set of categories (or “classes”) and give some examples of images from each category • The program should be able to categorize new (unseen) images following the categorization shown in these examples
Image categorization • This problem has received less attention in the research literature, and is probably also less interesting for practical use • Closely related to content-based image retrieval • IR needs to be able to find images similar to a query image • IC needs to determine whether a new image is similar to those from a particular category to decide whether it should belong there or not • Assumption: similar images should be in the same category
Image categorization • Combining image retrieval techniques with machine learning: • Describe each image with a vector,many ML approaches can work with vectors (e.g. SVM, decision trees, etc.) • Define a similarity measure on images, use the nearest-neighbour method (a.k.a. “instance-based learning”) or a related algorithm
Image categorization • In experiments with a certain database of 1172 images and 14 categories, the best algorithms produced models that classified about 75% images into the correct category • Other authors, using a different collection (990 images, 11 categories) and different algorithms, achieved accuracies around 80%
Conclusions • Image retrieval • Representations, similarity/relevance measures • Textual descriptions, keywords • Preparing, maintaining descriptions • Ambiguity, vocabulary problems • Retrieval by content • Image processing techniques • Image classification • Representations (as above) • Machine learning algorithms