Download
1 / 27
290 likes | 575 Views
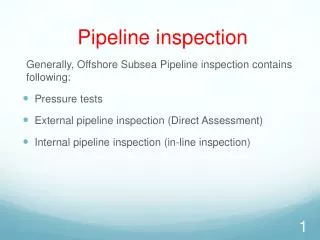
The Role of Inspection During the Lifetime of a Pipeline . Technical Conference: 7 th ASIAN PIPELINE CONFERENCE AND EXHIBITION, 11-12 October 2011 Istana Hotel, Kuala Lumpur, Malaysia Jim COSTAIN Global Leader, Oil & Gas GE MEASUREMENT AND CONTROL SOLUTIONS. Industry Drivers.

E N D
The Role of Inspection During the Lifetime of a Pipeline Technical Conference: 7th ASIAN PIPELINE CONFERENCE AND EXHIBITION, 11-12 October 2011 Istana Hotel, Kuala Lumpur, Malaysia Jim COSTAIN Global Leader, Oil & Gas GE MEASUREMENT AND CONTROL SOLUTIONS
Industry Drivers Aging Pipeline Infrastructure Consequences of Pipeline Failure > 20 Years 62% 11 to 20 Years 22 % Injury & Loss of Life … Environmental Damage < 10 Years14% New 2% Headlines from Pipeline Failures Cost of Corrosion • Cost of Corrosion (US, 1998) was estimated at a total of $276 billion per year. • Corrosion experts estimate that a net of 20 to 25% of that annual cost can be saved by applying currently available corrosion control technologies • Global estimates at least 4x the numbers above Oil Major Is Fined $25 Million for ’06 Spills at Pipelines By JOHN M. BRODER Published: May 3, 2011 in the NYTimes Gas Major fined P24.2 million over pipeline leak By ELLALYN B. DE VERA Published: November 23, 2010 in the Manila Buletin Lost Production.. Repair Costs.. Damaged Public Image Corrosion Costs in the USA 4% of GDP annually (Source: USA Department of Transportation)
Measurement & Control SolutionsHigh accuracy technologies… Nondestructive Testing Cutting edge inspection solutions to smartly monitor plant asset health without major disruption Monitoring assets through the lifecycle Asset Condition MonitoringSensors, monitors and software to monitor asset integrity Predictive Maintenance Software and predictive maintenance strategies & solutions for safe, more efficient operation Environmental Monitoring Radiation detection and emissions measurement for cleaner operation Sensors & Measurement Instrumentation and systems for validating critical processes and applications in high growth industries
Inspection Technologies Remote VisualInspection Testing Machines Ultrasonic Radiography Eddy Current Film, Equipment and Chemistry Digital Radiography(FS, CR, DR) X-ray Generators Instruments and Probes Automated Systems Video Borescopes Borescopes Fiberscopes PTZ Cameras Robotic Crawlers Inspection Services Rentals Ultrasonic and X-ray Standard Customized Flaw Detectors Thickness Gauges Hardness Testers System Instrumentation Transducers Installed Sensors Metrology Data Management Software Non-contact Air Foil System Rhythm Acquire Rhythm Review Rhythm Archive
Inspection Technologies During the Manufacturing Process Depending on the manufacturing process (ERW, SAW) and on the subsequent use of the tube, there are several options where in the process and to what extent non-destructive testing can be applied. Testing machines are typically operated inline with the manufacturing process and need to be designed according to individual requirements based on flaw detectability and test speed. Ultrasonic and X-Ray testing in the SAW process Ultrasonic testing in the ERW process
SAW - Ultrasonic testing machines Weld testing on SAW longitudinally welded tubes(linear transported tubes)
SAW – Ultrasonic testing machines Spirally welded tubes Strip testing (body and edge) with stationary probes
SAW - X-Ray testing machines Weld testing of SAW longitudinally welded tubes
Weld quality is a critical part of any project in the O&G market whether a new refinery, offshore platform or cross country or subsea pipeline. GE S&I has a comprehensive portfolio of solutions from the pipe mill to the field. Using state of the art UT and RT technology, GE can provide fit for purpose tools to suit all types of weld examinations. Weld Inspection Automated UT CR for offshore girth welds
USM Vision Weld Inspection Solution Key Features Menu guided set-up and inspection to optimize time of inspector capabilities Meets international codes & standards Data analysis, reporting, and sharing with GEIT Rhythm
USM Vision Weld Inspection Solution Level I or II UT or RT inspector performs inspection Administrator inputs data Level III reviews plan Adminstratorgenerates report and archives data Level II/III reviews data Inspection Plan Creation Data Acquisition Data Analysis Reporting Archive Rhythm IPC PA & TOFD Rhythm Reporting Rhythm Review Rhythm Archive Probe/Scanner Cal Blocks
USM Vision Guided Inspection Workflow Inspection preparation UT Expert Non UT Specialist Non UT Specialist UT Inspector UT Expert (Remote)
The GE Rightrax systemThe smart way to monitor wall thickness • Rightrax Applications in Oil & Gas • Upstream, Exploration and Production • Offshore Installations • Unmanned Offshore Installations • FPSO • Midstream, Transportation • Cross-country pipe lines • Downstream, Processing and Refining • Refineries • Petrochemicals • Rightrax is a system that can measure wall thickness continuously by using permanently installed UT transducers. • Rightrax consists of two product versions. • A low temperature -40°C <120°C / -40°F < 248°Fsystem • A high temperature version -20°C<500°C / -4°F < 932°F system • Both systems are non intrusive and can be installed on live pipelines • Both system installed versions have hazardous area certification • Installed without any welding • Data can be easily read by Asset Integrity and easily transferable to existing RBI program
System configurations • 1. PORTABLE • For both LT and HT systems • Manually operated • Data collection in the field • Data download to PC or laptop • Manual assessment of data • ADVANTAGE • Lower system cost • Flexibility of system use • 2. INSTALLED • For both LT and HT systems • Automatically operated • Fixed interval measurements • Data storage • Manual data collection • Manual assessment of data • ADVANTAGE • System is certified for HAZ use • No human intervention for measurements • Monitor process related events • 3. INTEGRATED • For both LT and HT systems • Automatically operated • Fixed interval measurements • Data storage • Automatic data analyses • Integration with third party systems with data and alarming • ADVANTAGE • System is certified for HAZ use • No human intervention required • Monitor process related events • System alarming on special events and conditions
Upstream Case Study • Concern: • Unmanned offshore installations require frequent wall thickness monitoring due to unpredictable sand erosion. • 6” & 8” Lines: 6-8mm wall thickness • Erosion rates can be up to 4mm / 24 hours • Monitoring is required and location is remote • Normal Operational Temperature is 80°C • Solution: • Total of 96 Rightrax M2 sensors on 6 individual platforms • M2 sensors wired back to DL2 Datalogger and LD2 in hazardous area • LD2 line driver connected to RTU using Modbus interface and VFC contacts • Configuration: • Measurements made every 8 hours • Data analysed on the LD2 line driver • Measure to 5mm thickness with VFC dry contact alarm if threshold thickness value is violated • Data sent to Onshore Control Room to analyse and monitor riser wall thickness • Data by Modbus Via RTU – HMI - PCS • Value and cost saving: • No bi-weekly mobilization of personnel • Monitoring critical process and preventing incidents • More operational control (pressure and flow) • Less downtime offshore onshore
Midstream Case Study • Concern: • Measure Water, H2S, & CO2 Corrosion on Underground Natural Gas Allocation, Transmission & Distribution Lines • Monitor reduction of pipe wall thickness at top, sides, and bottom locations along the pipes • Solution: • Initially Twelve (12) Measurement Locations • Four (4) M2 Sensors per TML • 18 Mtr Extension Cable wired back to Data collection post • Manual DL2 Datalogger • Configuration: • Measurements made manually as per customer’s required time frames • Data stored on DL2 • Data analyzed via downloading DL2 to customer’s PC w/ supplied software • Value and cost saving: • Covered known & suspected corrosion locations • Long Design/Performance Life • Inexpensive: Met Customer’s Needs • Met Political & Regulatory issues/concerns M2 sensors Natural Gas Pipeline
Subsea Direct Radiography Development Project
Subsea Direct Radiography Project • Corrosion/Erosion • ROV or diver deployed • Now rated to 1800ft (600m) • Planned 9000ft (3000m) • All trials completed • First inspection Oct 2011
Rhythm - Turning information into intelligence Capture, share, analyze, report, and archive digital inspection information Consistent Quick Reports Remote Review & Analysis Data Storage & Enables Trending Rhythm CR Rhythm Report Rhythm Review Rhythm Archive Rhythm DR LAN LAN Rhythm Visual Rhythm UT Multi-Modality Platform
Common Rhythm Platform Review DICONDE “One standard = One platform” Inspect Report Share Archive