Download
1 / 26
260 likes | 423 Views
Breakeven Advertising. Most Common Cost Based Tool. The decision to adopt an advertising plan starts with an estimate of the Breakeven Point Is the Breakeven needed to cover the new Advertising expense “reasonable”. The Proposal.

E N D
Most Common Cost Based Tool • The decision to adopt an advertising plan starts with an estimate of the Breakeven Point • Is the Breakeven needed to cover the new Advertising expense “reasonable”
The Proposal • You have a plan that increases the current advertising budget by $200,000. • Your boss will ask you, How many more units do we have sell to breakeven? • If the Price is $50 a unit and the variable cost is $10 per unit, how many units must be sold to breakeven? • Answer: F/(P-V) = 200,000/(50-10) = 50,000
The Proposal • You have a plan that increases the current advertising budget by $200,000. • Your boss will ask you, How many more units do we have sell to breakeven? • If the Price is $50 a unit and the variable cost is $10 per unit, how many units must be sold to breakeven? • Answer: F/(P-V) = 200,000/(50-10) = 5,000
Is the BEQ a Reasonable Goal? • Will we generate a minimum of 5,000 units in additional sales? • The boss will then use a combination of her experience, intuition, judgment, and her research finding to say Go or No Go to the plan to spend $200,000
Marketing Leverage Tracking The Changes from Period to Period
Marketing leverage • The spread between the firm’s current breakeven quantity (BEQ) and the firm’s current volume is an indicator of the firm’s current strategic health. • A trend that shows the distance between the firm’s current breakeven quantity and the firm’s current sales volume shrinking is a bad sign. • A trend that shows the distance between the firm’s breakeven quantity and the firm’s current sales volume increasing is a good sign.
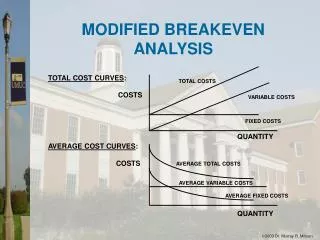
Breakeven for Current Operation • The total fixed or period cost of running the firm in the last period were • Total Fixed Cost = Total Promotion + Overhead + Research and Development • Breakeven for total operation = (Total Fixed Cost) / (price -variable cost) • BEQ = F/P-V
Marketing Leverage • Current Sales Volume = Leverage Index x BEQ • Leverage Index = Current Sales Volume/BEQ • The leverage index should be greater than 1
What is the total fixed cost? Simple Operating Statement
What is the total fixed cost? Simple Operating Statement Total Fixed Costs 3,700,000
Total Leverage • Breakeven Quantity for Current Operation • BEQ = Total Fixed Costs / (P-V) • BEQ = $3,700,000/($90 -$30) • BEQ = 61,667 units Current Sales Volume = 80,000 units Leverage = Current Volume/BEQ Leverage = 80,000/61,667 = 1.29
Total Leverage • Breakeven Quantity for Current Operation • BEQ = Total Fixed Costs / (P-V) • BEQ = $3,700,000/($90 -$30) • BEQ = 61,667 units Current Sales Volume = 80,000 units Leverage = Current Volume/BEQ Leverage = 80,000/61,667 = 1.29
Advertising Efficiency • A basic measure of marketing efficiency is • The number of units being sold for every dollar or $1,000 spent on advertising and promotions, etc. • Quantity sold = (Advertising Efficiency) x (Advertising Budget) • Advertising Efficiency = (Quantity Sold) / (Advertising Budget)
Advertising Leverage • The spread between the current number of units being sold for every $1,000 of promotion • and • the quantity needed to breakeven for an additional $1,000 of promotion • is a measure of Advertising leverage
Advertising leverage • Units sold per $1,000 in advertising = (Sales Volume) /(Advertising in thousands) • BEQ for $1,000 in advertising = $1,000/(P-V) • Units sold per $1,000 of Advertising = (Advertising Leverage) x BEQ • Advertising leverage = (Units sold per $1,000) / (BEQ for a $1,000)
Advertising leverage • Units sold per $1,000 in advertising = (Sales Volume) /(Advertising in thousands) • BEQ for $1,000 in advertising = $1,000/(P-V) • Units sold per $1,000 of Advertising = (Advertising Leverage) x BEQ • Advertising leverage = (Units sold per $1,000) / (BEQ for a $1,000)
Promotion leverage • Units sold per $1,000 in Promotion = Sales Volume / Promotion(in thousands) • Units sold per $1,000 = 80,000/2,980 = 26.85 • BEQ for a $1,000 = $1,000/(P-V) • BEQ for a $1,000 = $1,000/(90-30) = 16.67 • Leverage = 26.85/16.67 = 1.6 or 160%
Example • Your boss has seen a change in the advertising leverage over the past two periods. In period 3 the leverage index was 160% and in period 4 the leverage index was 140%. Should he be worried or happy? • Answer: Yes because the gap between the breakeven quantity and the units being sold is shrinking
Example • Your boss has seen a change in the advertising leverage over the past two periods. In period 3 the leverage index was 160% and in period 4 the leverage index was 140%. Should he be worried or happy? • Answer: Worried. Because the gap between the breakeven quantity and the volume of units being sold is shrinking
Changes from period to period • Is the change in the Leverage index due to • 1) changes in the BEQ ratio? • $1,000/(P-V) Shrinking margins? • 2) changes in the sales volume to promotion ratio? Less efficient advertising?
Marketing managers like to have a simple index, like a sales leverage, or a markup, or a return on sales, etc. to track strategic changes over time
Any Questions on Using Breakeven as a Static or Dynamic Benchmark for Evaluating a Promotion Budget?