Download
1 / 9
90 likes | 205 Views
Performance. of Turby Mk I at the Schoondijke (Nl) testsite compared with Turby Mk Ia in Cadaques (Sp). Oktober 2010. Weibull parameters wind speed distribution Cadaques: A = 7,80 m/s k = 1,444 V_wind = 7,08 m/s.

E N D
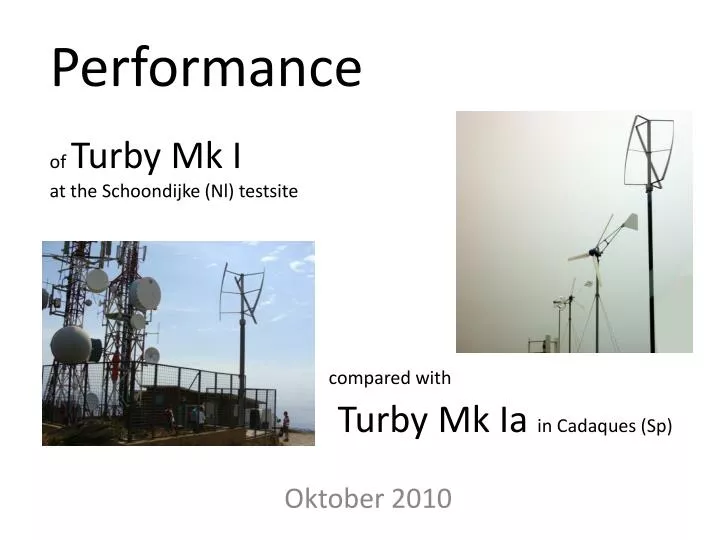
Performance of Turby Mk I at the Schoondijke (Nl) testsitecompared withTurby Mk Ia in Cadaques (Sp) Oktober 2010
Weibull parameters wind speed distribution Cadaques: A = 7,80 m/s k = 1,444 V_wind = 7,08 m/s Histogram of wind speed (x –axis) versus frequency of occurence (y-axis) Weibull parameters Wind speed distribution verdeling Schoondijke: A = 4,01 m/s k = 1,687 V_wind = 3,58 m/s
Relationbetween wind speed (x-axis) and mechanicalfrequency of turbine (y-axis) No data available of MkIa Schoondijke
Cadaques Same scale! Relationbetween wind speed (x-axis) and power (y-axis) Schoondijke
Relationbetween windspeed (x-axis) and overall conversion efficiency (y-axis)
Relationbetween wind speed (x-axis) and annualyield (y-axis)
Relationbetween wind speed (x-axis) and specificyield (y-axis)
Expectedannualspecificyield “upper” and “lower” limits (y) versus windspeed (x) And Paul Gipe’sexpectationsforlarge (black) and small (blue) windturbines