Download
1 / 15
150 likes | 211 Views
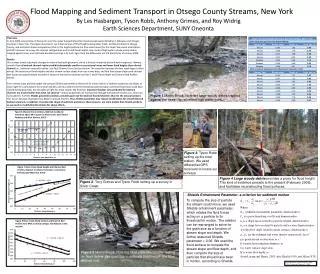
Documentation and Analysis of Flash Flood Prone Streams and Subwatershed Basins in Pulaski County, Virginia. Anthony Phillips Department of Geography Virginia Tech In Cooperation with:. Research Purpose Statement.

E N D
Documentation and Analysis of Flash Flood Prone Streams and Subwatershed Basins in Pulaski County, Virginia Anthony Phillips Department of Geography Virginia Tech In Cooperation with:
Research PurposeStatement • Identify, measure, and analyze areas in Pulaski County that are prone to flash flooding using GIS. • Results tobe compiled in digital form of DVD, as well as in paper form in an operational handbook. • All data to be overlaid in Google Earth and accessible from workstations at the NWS.
Research PurposeWhy do we care about flash flooding? • #1 weather-related killer in the United States! • Can occur nationwide, in any environment, but primarily affects these areas in Pulaski County: • River flooding • Small stream flooding • Urban flooding • Dry wash flooding
Selecting Flash Flood Prone AreasESRI's ArcGIS • USGS road and stream shapefiles were imported into ArcGIS. • Software was used to select points where roads and streams were within 25’ of each other. • 651 points identified.
FieldworkData collected • Following data collected at each road-stream intersect point: • Road name • Road type • Stream name • Stream flow (slow, normal, fast, none) • Distance from road to stream • Angle of depression • Upstream picture • Downstream picture
FieldworkCalculating the flood stage for each survey point • Distance from road to stream calculated from eye-level to stream edge. • Standard 50’ measuring tape. • From same location, angle of depression measured from eye-level to stream edge. • Clinometer
θ° 6’ 6’ d FS FS= [d x SIN(θ°)] – 6’ Picture by Sarah Prescott
Finalizing the DataWhy only 319 points? • Of the 651 points initially plotted by ArcGIS, 319 were fully documented. • The remaining 332 points were either on private roads or were not likely to have flash flooding.
Finalizing the DataArcGIS and aerial photography of each subbasin • Final data was imported into ArcGIS. • Each measured point was color-coded to indicate the flood stage height. • Red: <1.5’ • Orange: 1.5 – 3.0’ • Yellow: 3.0 – 5.0’ • Green: 5.0 – 8.0’ • Turquoise: 8.0 – 12.0’ • Blue: >12.0’
Finalizing the DataArcGIS and aerial photography of each subbasin • 2007 aerial photography serves as the background for each map. • Additionally, each map includes all roads and streams with their associated names, as well as an inset map of surrounding elevation.
Finalizing the DataGoogle Earth • The location and information for each measured point was imported into Google Earth. • Additionally, each subwatershed basin was also imported. • Points used the same color-coded symbology.
Results and ConclusionsWhat we’ve learned so far… • The project has been a complete success! • Areas that are susceptible to flash flooding have been fully documented. • All information has been mapped and imported into Google Earth. • Information available to the NWS and County of Pulaski in the form of a handbook and DVD. • Project expanding to include Montgomery County and Virginia Tech Questions?
Acknowlegements • Dave Carroll, VT Advisor • Steve Keighton, NWS Science Operations • Peter Corrigan, NWS Hydrologist • Jan Jackson, NWS Senior Forecaster • Bobby Clark, Pulaski County Emergency Manager • Sarah Prescott, Field Assistant • VT McNair SRE Staff