Download
1 / 1
10 likes | 177 Views
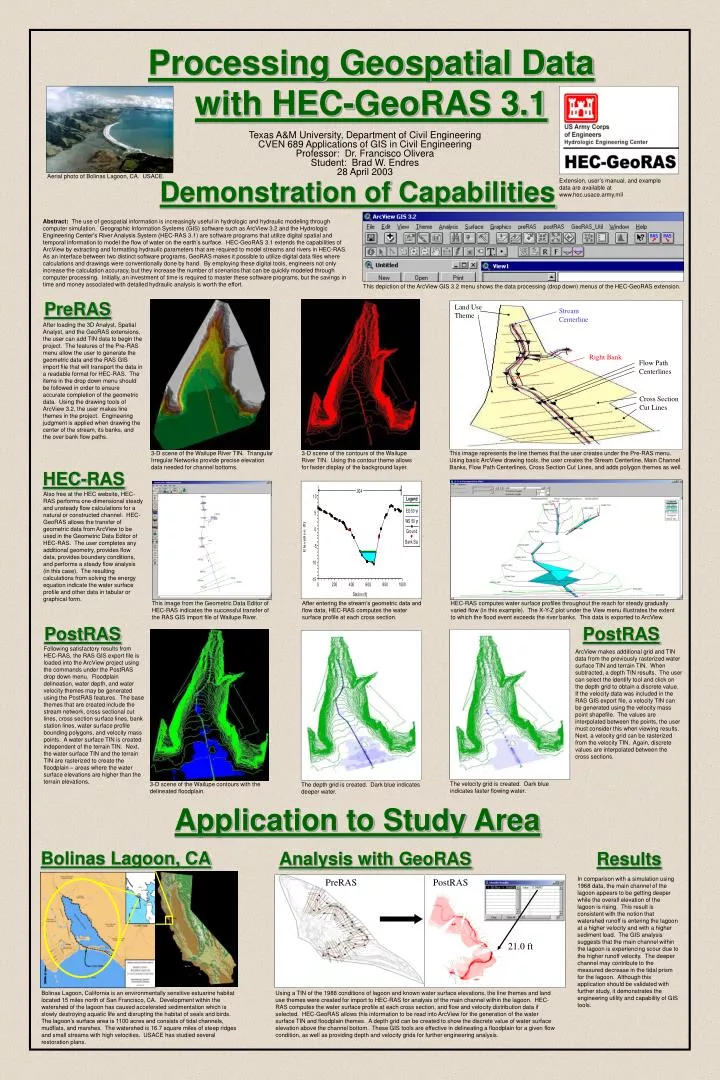
Land Use Theme. Stream Centerline. PreRAS. PostRAS. Right Bank. Flow Path Centerlines. Cross Section Cut Lines. 21.0 ft. Processing Geospatial Data with HEC-GeoRAS 3.1. Texas A&M University, Department of Civil Engineering CVEN 689 Applications of GIS in Civil Engineering

E N D
Land Use Theme Stream Centerline PreRAS PostRAS Right Bank Flow Path Centerlines Cross Section Cut Lines 21.0 ft Processing Geospatial Data with HEC-GeoRAS 3.1 Texas A&M University, Department of Civil Engineering CVEN 689 Applications of GIS in Civil Engineering Professor: Dr. Francisco Olivera Student: Brad W. Endres 28 April 2003 Aerial photo of Bolinas Lagoon, CA. USACE. Demonstration of Capabilities Extension, user’s manual, and example data are available at www.hec.usace.army.mil Abstract: The use of geospatial information is increasingly useful in hydrologic and hydraulic modeling through computer simulation. Geographic Information Systems (GIS) software such as ArcView 3.2 and the Hydrologic Engineering Center’s River Analysis System (HEC-RAS 3.1) are software programs that utilize digital spatial and temporal information to model the flow of water on the earth’s surface. HEC-GeoRAS 3.1 extends the capabilities of ArcView by extracting and formatting hydraulic parameters that are required to model streams and rivers in HEC-RAS. As an interface between two distinct software programs, GeoRAS makes it possible to utilize digital data files where calculations and drawings were conventionally done by hand. By employing these digital tools, engineers not only increase the calculation accuracy, but they increase the number of scenarios that can be quickly modeled through computer processing. Initially, an investment of time is required to master these software programs, but the savings in time and money associated with detailed hydraulic analysis is worth the effort. This depiction of the ArcView GIS 3.2 menu shows the data processing (drop down) menus of the HEC-GeoRAS extension. PreRAS After loading the 3D Analyst, Spatial Analyst, and the GeoRAS extensions, the user can add TIN data to begin the project. The features of the Pre-RAS menu allow the user to generate the geometric data and the RAS GIS import file that will transport the data in a readable format for HEC-RAS. The items in the drop down menu should be followed in order to ensure accurate completion of the geometric data. Using the drawing tools of ArcView 3.2, the user makes line themes in the project. Engineering judgment is applied when drawing the center of the stream, its banks, and the over bank flow paths. 3-D scene of the Wailupe River TIN. Triangular Irregular Networks provide precise elevation data needed for channel bottoms. 3-D scene of the contours of the Wailupe River TIN. Using the contour theme allows for faster display of the background layer. This image represents the line themes that the user creates under the Pre-RAS menu. Using basic ArcView drawing tools, the user creates the Stream Centerline, Main Channel Banks, Flow Path Centerlines, Cross Section Cut Lines, and adds polygon themes as well. HEC-RAS Also free at the HEC website, HEC-RAS performs one-dimensional steady and unsteady flow calculations for a natural or constructed channel. HEC-GeoRAS allows the transfer of geometric data from ArcView to be used in the Geometric Data Editor of HEC-RAS. The user completes any additional geometry, provides flow data, provides boundary conditions, and performs a steady flow analysis (in this case). The resulting calculations from solving the energy equation indicate the water surface profile and other data in tabular or graphical form. This image from the Geometric Data Editor of HEC-RAS indicates the successful transfer of the RAS GIS import file of Wailupe River. After entering the stream’s geometric data and flow data, HEC-RAS computes the water surface profile at each cross section. HEC-RAS computes water surface profiles throughout the reach for steady gradually varied flow (in this example). The X-Y-Z plot under the View menu illustrates the extent to which the flood event exceeds the river banks. This data is exported to ArcView. PostRAS PostRAS Following satisfactory results from HEC-RAS, the RAS GIS export file is loaded into the ArcView project using the commands under the PostRAS drop down menu. Floodplain delineation, water depth, and water velocity themes may be generated using the PostRAS features. The base themes that are created include the stream network, cross sectional cut lines, cross section surface lines, bank station lines, water surface profile bounding polygons, and velocity mass points. A water surface TIN is created independent of the terrain TIN. Next, the water surface TIN and the terrain TIN are rasterized to create the floodplain – areas where the water surface elevations are higher than the terrain elevations. ArcView makes additional grid and TIN data from the previously rasterized water surface TIN and terrain TIN. When subtracted, a depth TIN results. The user can select the identify tool and click on the depth grid to obtain a discrete value. If the velocity data was included in the RAS GIS export file, a velocity TIN can be generated using the velocity mass point shapefile. The values are interpolated between the points, the user must consider this when viewing results. Next, a velocity grid can be rasterized from the velocity TIN. Again, discrete values are interpolated between the cross sections. The velocity grid is created. Dark blue indicates faster flowing water. 3-D scene of the Wailupe contours with the delineated floodplain. The depth grid is created. Dark blue indicates deeper water. Application to Study Area Bolinas Lagoon, CA Analysis with GeoRAS Results In comparison with a simulation using 1968 data, the main channel of the lagoon appears to be getting deeper while the overall elevation of the lagoon is rising. This result is consistent with the notion that watershed runoff is entering the lagoon at a higher velocity and with a higher sediment load. The GIS analysis suggests that the main channel within the lagoon is experiencing scour due to the higher runoff velocity. The deeper channel may contribute to the measured decrease in the tidal prism for the lagoon. Although this application should be validated with further study, it demonstrates the engineering utility and capability of GIS tools. Bolinas Lagoon, California is an environmentally sensitive estuarine habitat located 15 miles north of San Francisco, CA. Development within the watershed of the lagoon has caused accelerated sedimentation which is slowly destroying aquatic life and disrupting the habitat of seals and birds. The lagoon’s surface area is 1100 acres and consists of tidal channels, mudflats, and marshes. The watershed is 16.7 square miles of steep ridges and small streams with high velocities. USACE has studied several restoration plans. Using a TIN of the 1988 conditions of lagoon and known water surface elevations, the line themes and land use themes were created for import to HEC-RAS for analysis of the main channel within the lagoon. HEC-RAS computes the water surface profile at each cross section, and flow and velocity distribution data if selected. HEC-GeoRAS allows this information to be read into ArcView for the generation of the water surface TIN and floodplain themes. A depth grid can be created to show the discrete value of water surface elevation above the channel bottom. These GIS tools are effective in delineating a floodplain for a given flow condition, as well as providing depth and velocity grids for further engineering analysis.