Download

1 / 44
690 likes | 1.33k Views
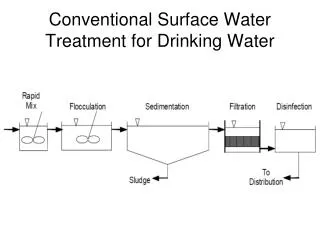
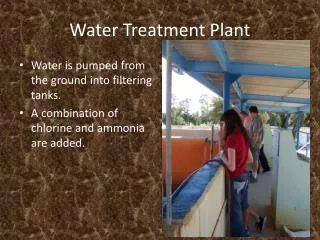
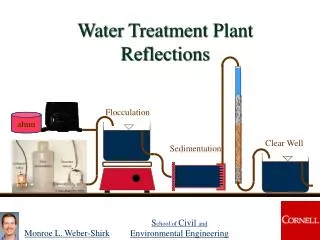
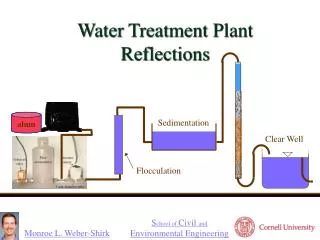
Surface Water Treatment Plant. Fig 4-8: Flow Diagram of conventional surface water treatment plant (“filtration plant”). Coagulation = Charge reduction Flocculation = Contact of particles. Fig 4-10: Effect of salt on electric potential. Fig 4-11: Effect of valence on electric potential.

E N D
Fig 4-8: Flow Diagram of conventional surface water treatment plant (“filtration plant”)
Coagulation = Charge reductionFlocculation = Contact of particles
Paddle Mixers in Left Chamber and Flocculators in Right Two Chambers
Fig 4-32: Zones of sedimentation on a horizontal flow clarifier
Fig 4-37: Partial solids removal in ideal sedimentation tank
Fig 4-37: Partial solids removal in ideal sedimentation tank
Let’s say v0 = 0.20 mm/sWhat % removal for particles with settlingvelocity = 0.15 mm/s?
Rapid sand filter with exposed under drain block.Wash water troughs run from left into gullet on right.
Rapid sand filter with water level just below backwash troughs. Note iron stain at high water line.
Rapid sand filter during filtration.Reflection shows water level above gullet and backwash troughs.
Rotameter used to measure flowrate of gaseous chlorine into water.
Hydrofluorosilicic acid drum and pump metering system for feeding fluoride into water.
Softening sludge lagoon. Winter view shows ice (light blue) where supernatant water is stnading.
Overview of water treatment plant showing sludge lagoons and building housing treatment facilities.