Download
1 / 72
720 likes | 877 Views
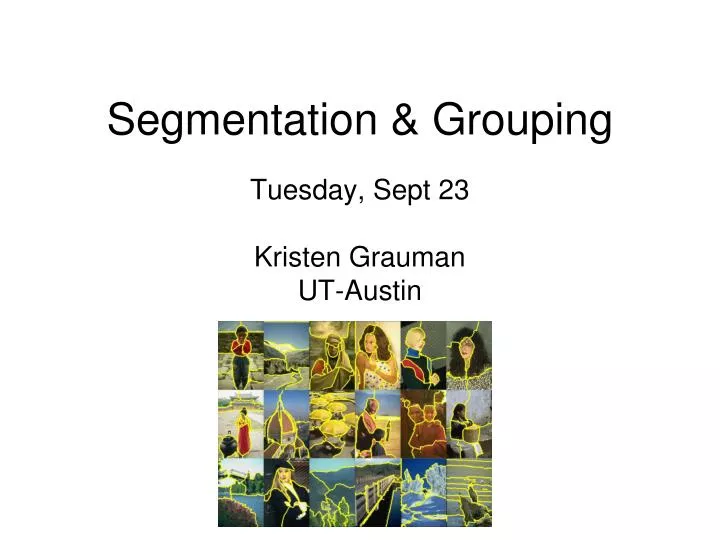
Segmentation & Grouping. Tuesday, Sept 23 Kristen Grauman UT-Austin. Last time. Texture is a useful property that is often indicative of materials, appearance cues Texture representations attempt to summarize repeating patterns of local structure

E N D
Segmentation & Grouping Tuesday, Sept 23 Kristen Grauman UT-Austin
Last time • Texture is a useful property that is often indicative of materials, appearance cues • Texturerepresentations attempt to summarize repeating patterns of local structure • Filter banks useful to measure redundant variety of structures in local neighborhood • Feature spaces can be multi-dimensional
Texture representation • Textures are made up of repeated local patterns, so: • Find the patterns • Use filters that look like patterns (spots, bars, raw patches…) • Consider magnitude of response • Describe their statistics within each local window • Mean, standard deviation • Histogram • Histogram of “prototypical” feature occurrences
Texture representation: example original image … statistics to summarize patterns in small windows derivative filter responses, squared
Texture representation: example original image … statistics to summarize patterns in small windows derivative filter responses, squared
Texture representation: example original image … statistics to summarize patterns in small windows derivative filter responses, squared
Texture representation: example original image … … statistics to summarize patterns in small windows derivative filter responses, squared
Texture representation: example Dimension 2 (mean d/dy value) Dimension 1 (mean d/dx value) … … statistics to summarize patterns in small windows
Texture representation: example Dimension 2 (mean d/dy value) Far: dissimilar textures Close: similar textures Dimension 1 (mean d/dx value) … … statistics to summarize patterns in small windows
Texture representation: example Dimension 2 Dimension 1
Texture representation: example Dimension 2 Dimension 1 Distance reveals how dissimilar texture from window a is from texture in window b.
Example application of a filter bank Filter bank of 8 filters Input image 8 response images : magnitude of filtered outputs, per filter
d-dimensional features General definition of inter-point distance . . . 3d 2d
Review questions • When describing texture, why do we collect filter response statistics within a window? • What is the Markov assumption? • And why is it relevant for the texture synthesis technique of Efros & Leung?
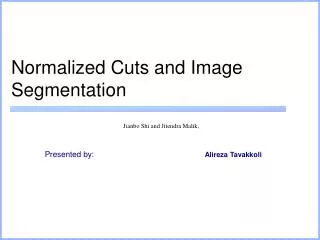
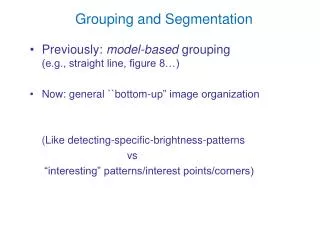
Outline What are grouping problems in vision? Inspiration from human perception Gestalt properties Bottom-up segmentation via clustering Algorithms: k-means, graph-based Features: color, texture, …
Grouping in vision • Goals: • Gather features that belong together • Obtain an intermediate representation that compactly describes key image (video) parts
Examples of grouping in vision [http://poseidon.csd.auth.gr/LAB_RESEARCH/Latest/imgs/SpeakDepVidIndex_img2.jpg] Group video frames into shots [Figure by J. Shi] Determine image regions Fg / Bg [Figure by Wang & Suter] Figure-ground [Figure by Grauman & Darrell] Object-level grouping
Grouping in vision • Goals: • Gather features that belong together • Obtain an intermediate representation that compactly describes key image (video) parts • Top down vs. bottom up segmentation • Top down: pixels belong together because they are from the same object • Bottom up: pixels belong together because they look similar • Hard to measure success • What is interesting depends on the app.
Similarity http://chicagoist.com/attachments/chicagoist_alicia/GEESE.jpg, http://wwwdelivery.superstock.com/WI/223/1532/PreviewComp/SuperStock_1532R-0831.jpg
Symmetry http://seedmagazine.com/news/2006/10/beauty_is_in_the_processingtim.php
Common fate Image credit: Arthus-Bertrand (via F. Durand)
Proximity http://www.capital.edu/Resources/Images/outside6_035.jpg
Gestalt Gestalt: whole or group Whole is greater than sum of its parts Relationships among parts can yield new properties/features Psychologists identified series of factors that predispose set of elements to be grouped (by human visual system)
Muller-Lyer illusion Gestalt principle: grouping key to visual perception.
Illusory/subjective contours Interesting tendency to explain by occlusion In Vision, D. Marr, 1982
In Vision, D. Marr, 1982; from J. L. Marroquin, “Human visual perception of structure”, 1976.
Gestalt Gestalt: whole or group Whole is greater than sum of its parts Relationships among parts can yield new properties/features Psychologists identified series of factors that predispose set of elements to be grouped (by human visual system) Inspiring observations/explanations, but not necessarily directly useful for algorithms.
Outline What are grouping problems in vision? Inspiration from human perception Gestalt properties Bottom-up segmentation via clustering Algorithms: k-means, graph-based Features: color, texture, …
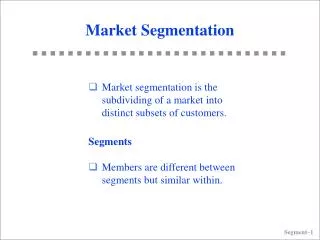
Image segmentation Goal: identify groups of pixels that go together.
The goals of segmentation • Separate image into coherent “objects” human segmentation image Source: Lana Lazebnik
The goals of segmentation • Separate image into coherent “objects” • Group together similar-looking pixels for efficiency of further processing “superpixels” X. Ren and J. Malik. Learning a classification model for segmentation. ICCV 2003. Source: Lana Lazebnik
Image segmentation: toy example black pixels white pixels pixel count 3 gray pixels 2 1 input image intensity • These intensities define the three groups. • We could label every pixel in the image according to which of these primary intensities it is. • i.e., segment the image based on the intensity feature. • What if the image isn’t quite so simple?
pixel count input image intensity pixel count input image intensity
pixel count input image intensity • Now how to determine the three main intensities that define our groups? • We need to cluster.
3 2 1 intensity • Goal: choose three “centers” as the representative intensities, and label every pixel according to which of these centers it is nearest to. • Best cluster centers are those that minimize SSD between all points and their nearest cluster center ci: 190 255 0
Clustering • With this objective, it is a “chicken and egg” problem: • If we knew the cluster centers, we could allocate points to groups by assigning each to its closest center. • If we knew the group memberships, we could get the centers by computing the mean per group.
K-means clustering • Basic idea: randomly initialize the k cluster centers, and iterate between the two steps we just saw. • Randomly initialize the cluster centers, c1, ..., cK • Given cluster centers, determine points in each cluster • For each point p, find the closest ci. Put p into cluster i • Given points in each cluster, solve for ci • Set ci to be the mean of points in cluster i • If ci have changed, repeat Step 2 Properties • Will always converge to some solution • Can be a “local minimum” • does not always find the global minimum of objective function: Source: Steve Seitz
K-means clustering • Java demo: http://home.dei.polimi.it/matteucc/Clustering/tutorial_html/AppletKM.html
Smoothing out cluster assignments 3 2 1 • Assigning a cluster label per pixel may yield outliers: original labeled by cluster center’s intensity ? • How to ensure they are spatially smooth?
Segmentation as clustering Depending on what we choose as the feature space, we can group pixels in different ways. Grouping pixels based on intensity similarity Feature space: intensity value (1-d)
K=2 K=3 img_as_col = double(im(:)); cluster_membs = kmeans(img_as_col, K); labelim = zeros(size(im)); for i=1:k inds = find(cluster_membs==i); meanval = mean(img_as_column(inds)); labelim(inds) = meanval; end