Download
1 / 21
210 likes | 340 Views
The hare birth rate is constant, as their food supply is unlimited. Hares only die when eaten by a lynx, and the number of hares eaten is proportional to how often hares & lynxes meet, i.e., the chance of a lynx catching a hare.

E N D
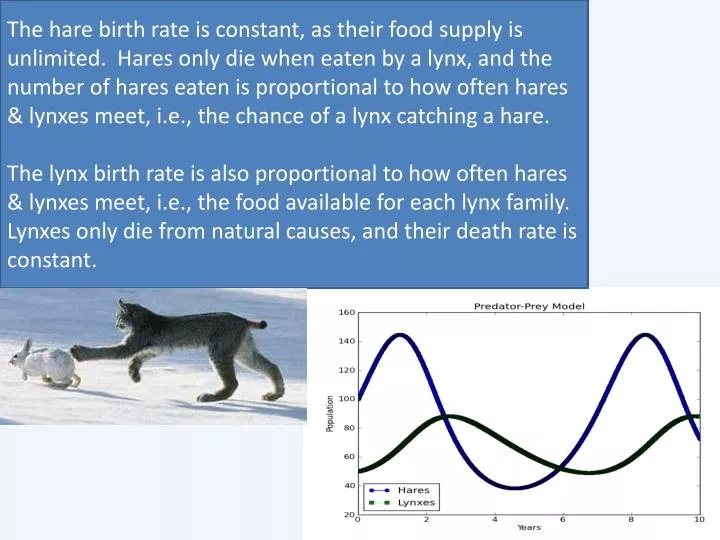
The hare birth rate is constant, as their food supply is unlimited. Hares only die when eaten by a lynx, and the number of hares eaten is proportional to how often hares & lynxes meet, i.e., the chance of a lynx catching a hare. The lynx birth rate is also proportional to how often hares & lynxes meet, i.e., the food available for each lynx family. Lynxes only die from natural causes, and their death rate is constant.
Computational Thinking Relevant input Problem description Computational goal Information extraction Algorithm design Algorithm implementation Abstraction Recipe (Algorithm) Automation Answer
Generate population data. • Repeatedly, generate next population. • Display population data. Given , , , , , , . Repeat these steps for : Plot for . Plot for .
Improve Algorithm • Separate parts • Generalize • Articulate goals
Generate population data. • Repeatedly, generate next population. • Display population data. Given , , , , , , . Repeat these steps for : Plot for . Plot for .
Given , , , , , , . Repeat these steps for : Return and .
Why Separate Parts? • Simpler • Independently useful
Generalize beyond Hares & Lynxes Given , , , , , , . Repeat these steps for : Return and .
Articulate Goals Populations: Given , , , , , , . Returns the predicted populations of two species, given their initial populations, the prey’s growth rate, the predation rate, the predator’s food conversion rate, the predator’s death rate, and the number of years to predict. Repeat these steps for : Return and .
Use What Kinds of Python Data? Populations: Given , , , , , , . Returns the predicted populations of two species, given their initial populations, the prey’s growth rate, the predation rate, the predator’s food conversion rate, the predator’s death rate, and the number of years to predict. Repeat these steps for : Return and .
and as Lists … …
Translate Piece by Piece Populations: Given , , , , , , . Returns the predicted populations of two species, given their initial populations, the prey’s growth rate, the predation rate, the predator’s food conversion rate, the predator’s death rate, and the number of years to predict. defpopulations (prey0,pred0,growth,predation,conversion,death,years) : """Returns the predicted populations of two species, given their initial populations, the prey's growth rate, the predation rate, the predator's food conversion rate, the predator's death rate, and the number of years to predict.""" prey = [prey0] pred= [pred0]
Translate Piece by Piece Repeat these steps for : for y inrange(years):
Translate Piece by Piece prey[y] + prey[y] * (growth-predation*pred[y]) prey.append( ) pred[y] + pred[y] * (conversion*prey[y]-death) pred.append( )
Translate Piece by Piece Return and . return prey , pred
Put the Function’s Pieces Together defpopulations(prey0,pred0,growth,predation,conversion,death,years): """Returns the predicted populations of two species, given their initial populations, the prey's growth rate, the predation rate, the predator's food conversion rate, the predator's death rate, and the number of years to predict.""" prey = [prey0] pred = [pred0] for y inrange(years): prey.append(prey[y] + prey[y] * (growth-predation*pred[y])) pred.append(pred[y] + pred[y] * (conversion*prey[y]-death)) return prey, pred
How to Use The Code? pred, prey = populations(100,50,.4,.003,.004,.2,10)
A Useful Aside defpopulations(prey0,pred0,growth,predation,conversion,death,years): """Returns the predicted populations of two species, given their initial populations, the prey's growth rate, the predation rate, the predator's food conversion rate, the predator's death rate, and the number of years to predict.""" prey = [prey0] pred = [pred0] for y inrange(years): print"y = ",y print"prey = ",prey print"pred= ",pred prey.append(prey[y] + prey[y] * (growth-predation*pred[y])) pred.append(pred[y] + pred[y] * (conversion*prey[y]-death)) return prey, pred
Plotting importmatplotlib.pyplotasplt defplotPopulations(times,prey,pred,preyName,predName): """Displays a plot of two populations over the given times.""" # Prey use circles connected by solid line. preyPlot= plt.plot(times, prey, 'o-') # Predators use squares connected by dotted line. predPlot= plt.plot(times, pred, 's:' ) # Place legend box in "best" location. plt.legend((preyPlot, predPlot), (preyName, predName), 'best') plt.xlabel('Years') plt.ylabel('Population') plt.title('Predator-Prey Model') plt.show()
Putting Everything Together importmatplotlib.pyplotasplt defpopulations(…): … defplotPopulations(…): … prey, pred = populations(100,50,.4,.003,.004,.2,10) times = range(len(prey)) plotPopulations(times,prey,pred,"Hare","Lynx")