Download
1 / 43
430 likes | 624 Views
Inventories. Generally, 2 types of inventories:. Merchandise (for sale) inventory. Processing Inventory. Raw Materials Inventory Work In Process Inventory. Inventories. When to Include Items?. Include items in inventory when ownership transfers. FOB (Free-on-Board):.

E N D
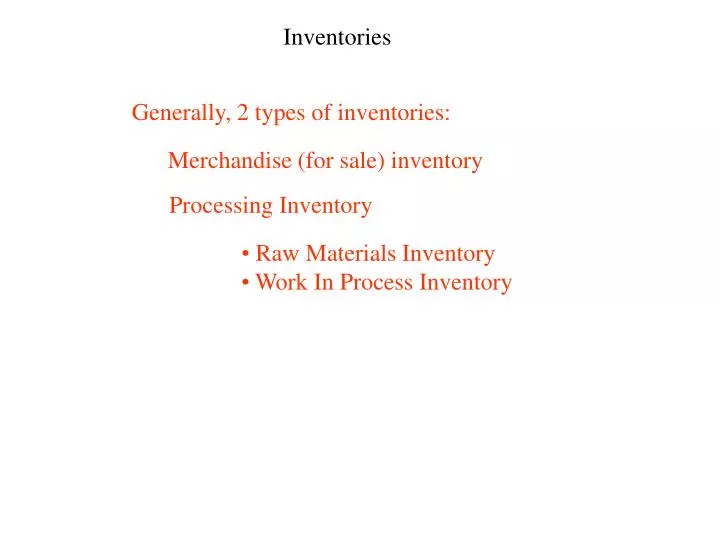
Inventories Generally, 2 types of inventories: Merchandise (for sale) inventory Processing Inventory • Raw Materials Inventory • Work In Process Inventory
Inventories When to Include Items? Include items in inventory when ownership transfers. FOB (Free-on-Board): • Specifies where ownership transfers. • Shipping Point: when delivered to carrier. • Destination: when delivered from carrier to recipient.
Inventories When to Include Items? Consignment: • Provide product to marketing agent (shopkeeper) to sell. • Marketing agent receives commission for sale. • Marketing agent does not take ownership. • Original owner retains ownership.
Inventories Generally, 2 ways to keep track of inventory: • Perpetual (real-time) tracking • Updates as items leave and arrive • e.g. Supermarket Scanners • Periodic tracking or counting • Inventory counted at regular intervals • Usually involves a hand-count • Inventory sold is “backed-into” by looking • at changes in inventory balance
Inventories Periodic Inventory System We take end of period count of inventory and compare to beginning inventory + newly purchased inventory to compute Cost of Goods Sold. • Information needed: • Beginning Inventory • Purchases • Ending Inventory
$5 $5 $5 $5 $5 Beginning Inventory = $15 Purchases = $10 Inventories Periodic Inventory System Cost of Goods Available for Sale = BI + Purchases = $25
$5 Ending Inventory = $5 Inventories Periodic Inventory System Cost of Goods Sold = Cost of Goods Available for Sale – EI = $25 - $5 = $20
$5 $5 $5 $5 $5 Available for Sale $25 Inventories Periodic Inventory System Let’s take another look…
$5 $5 $5 $5 $5 Ending Inv $5 Inventories Periodic Inventory System Available for Sale $25
$5 Inventories Periodic Inventory System Available for Sale $25 Ending Inv ($5) COGS $20 Sold $20 (or stolen)
Inventories Periodic Inventory System—Inventory Errors • Inventory Errors in a Periodic System directly hit Net Income. • These errors affect 2 periods. • The error in the first period is reversed in the second period. • i.e., if Net Income is overstated in period 1, it will be • understated in period 2.
Inventories Periodic Inventory System—Inventory Errors Period 1 Period 2 • Beg Inventory • + Purchases • = CoG Avail for Sale • Ending Inventory • = Cost of Goods Sold • Beg Inventory • + Purchases • = CoG Avail for Sale • Ending Inventory • = Cost of Goods Sold • Sales Revenue • Cost of Goods Sold • = Net Income • Sales Revenue • Cost of Goods Sold • = Net Income
Inventories Periodic Inventory System—Inventory Errors Period 1 Period 2 • Beg Inventory • + Purchases • = CoG Avail for Sale • Ending Inventory • = Cost of Goods Sold • Beg Inventory • + Purchases • = CoG Avail for Sale • Ending Inventory • = Cost of Goods Sold • Sales Revenue • Cost of Goods Sold • = Net Income • Sales Revenue • Cost of Goods Sold • = Net Income Assume we accidentally OVERCOUNT (overstate) 1st pd Ending Inv.
Inventories Periodic Inventory System—Inventory Errors Period 1 Period 2 • Beg Inventory • + Purchases • = CoG Avail for Sale • Ending Inventory • = Cost of Goods Sold • Beg Inventory • + Purchases • = CoG Avail for Sale • Ending Inventory • = Cost of Goods Sold (Too big) (Too small) • Sales Revenue • Cost of Goods Sold • = Net Income • Sales Revenue • Cost of Goods Sold • = Net Income
Inventories Periodic Inventory System—Inventory Errors Period 1 Period 2 • Beg Inventory • + Purchases • = CoG Avail for Sale • Ending Inventory • = Cost of Goods Sold • Beg Inventory • + Purchases • = CoG Avail for Sale • Ending Inventory • = Cost of Goods Sold (Too big) (Too small) • Sales Revenue • Cost of Goods Sold • = Net Income • Sales Revenue • Cost of Goods Sold • = Net Income (Too small) (Too big)
Inventories Periodic Inventory System—Inventory Errors Period 1 Period 2 • Beg Inventory • + Purchases • = CoG Avail for Sale • Ending Inventory • = Cost of Goods Sold • Beg Inventory • + Purchases • = CoG Avail for Sale • Ending Inventory • = Cost of Goods Sold (Too big) (Too big) • Sales Revenue • Cost of Goods Sold • = Net Income • Sales Revenue • Cost of Goods Sold • = Net Income
Inventories Periodic Inventory System—Inventory Errors Period 1 Period 2 • Beg Inventory • + Purchases • = CoG Avail for Sale • Ending Inventory • = Cost of Goods Sold • Beg Inventory • + Purchases • = CoG Avail for Sale • Ending Inventory • = Cost of Goods Sold (Too big) (Too big) (Too big) • Sales Revenue • Cost of Goods Sold • = Net Income • Sales Revenue • Cost of Goods Sold • = Net Income
Inventories Periodic Inventory System—Inventory Errors Period 1 Period 2 • Beg Inventory • + Purchases • = CoG Avail for Sale • Ending Inventory • = Cost of Goods Sold • Beg Inventory • + Purchases • = CoG Avail for Sale • Ending Inventory • = Cost of Goods Sold (Too big) • Sales Revenue • Cost of Goods Sold • = Net Income • Sales Revenue • Cost of Goods Sold • = Net Income (Too big) (Too small)
Inventories Periodic Inventory System—Inventory Errors Period 1 Period 2 • Beg Inventory • + Purchases • = CoG Avail for Sale • Ending Inventory • = Cost of Goods Sold • Beg Inventory • + Purchases • = CoG Avail for Sale • Ending Inventory • = Cost of Goods Sold (Too big) • Sales Revenue • Cost of Goods Sold • = Net Income • Sales Revenue • Cost of Goods Sold • = Net Income (Too big) (Too small) Note the reversal in the 2nd period.
Inventories Valuing inventory stock (determining COGS) • A common problem is that inventory is often brought in with different cost layers. • Different methods to value inventory: • Specific Identification: each item tracked at actual value • Average Cost Method: use weighted average cost of items • First-in-First-Out • Last-in-First-Out
Inventories Average Cost Method Sell 300 units: Average cost = $3,100 / 500 = $6.20 per unit Cost of Goods Sold = $6.20 x 300 units = $1,860
Inventories Average Cost Method 200 $1,240 Sell 300 units: Average cost = $3,100 / 500 = $6.20 per unit After Sale, 200 units left. Unit cost now adjusted to $6.20.
Inventories Average Cost Method Any new purchases create new layers and a new average will be computed. $1,890 / 300 = $6.30 per unit
These layers are depleted first. (Top down). Inventories FIFO Method Sell 250 units: 100 x $5 = $500 150 x $6 = $900 COGS = $1,400
These layers are depleted first. (Bottom up.) Inventories LIFO Method Sell 250 units: 200 x $7 = $1,400 50 x $6 = $300 COGS = $1,700
Inventories Differences in Methods • Weighted Average has least potential for manipulation • LIFO has highest COGS (lowest Net Income) during • rising inflation • FIFO has the lowest COGS (highest Net Income) during • rising inflation • Specific Identification may be the most accurate
Inventories Problems with LIFO • LIFO Liquidation is an issue when, due to high demand, • a firm using LIFO has to dip deep into its inventory. • When this happens, many of the earlier (cheaper) layers • get liquidated. • This forces the firm to match revenues against cheaper, • and likely less accurate costs. • One potential remedy is the Dollar Value LIFO Method
Inventories Dollar Value LIFO • To use Dollar Value LIFO, you only need to know two things: • Ending Value of Total Inventory • The rate of inflation • From these, you “back out” the layers of inventory
$99,000 increase in value Inventories Dollar Value LIFO 1999 Ending Inventory Value 2000 Ending Inventory Value $200,000 $299,000 Is this increase in value due to purchases of new inventory or due to inflation? Both!
Inventories Dollar Value LIFO 1999 Ending Inventory Value 2000 Ending Inventory Value $200,000 $299,000 To find out actual inventory purchases, we need to deflate (discount) the 2000 Ending Inventory back to 1999 price levels. This effectively wipes away the inflation effect to give us the true purchases effect.
x 0.8696 1 = 0.8696 1.15 Inventories Dollar Value LIFO 1999 Ending Inventory Value 2000 Ending Inventory Value $200,000 $299,000 If price index is 15%, the discount multiplier is: $260,000
$60,000 of actual inventory increase (stated at year 1999 price levels) Inventories Dollar Value LIFO 1999 Ending Inventory Value 2000 Ending Inventory Value $200,000 $299,000 x 0.8696 $260,000
Inventories Dollar Value LIFO
Inventories Dollar Value LIFO
Inventories Dollar Value LIFO
Inventories Dollar Value LIFO
Inventories Dollar Value LIFO This is the real increase reinflated = 60,000 x 1.15 = 69,000
Inventories Dollar Value LIFO
Inventories Dollar Value LIFO Assume a price index of 120 percent in this year.
Inventories Dollar Value LIFO
Inventories Dollar Value LIFO
Inventories Dollar Value LIFO This is the real increase reinflated = 40,000 x 1.20 = 48,000
Inventories Dollar Value LIFO This is how the inventory would be layered on the books.