Download
1 / 24
240 likes | 454 Views
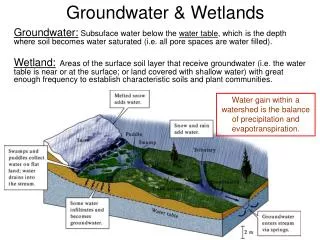
Groundwater Recharge Spring Flow and Wetlands. Spring discharges have been related to pressure head and volume of water in aquifers. Wetland preservation has been related to the volume of groundwater and its proximity to the wetland.

E N D
Groundwater Recharge Spring Flow and Wetlands • Spring discharges have been related to pressure head and volume of water in aquifers. • Wetland preservation has been related to the volume of groundwater and its proximity to the wetland. • Volume and head of groundwater is related to the recharge of water and withdrawals.
C C
Example Impervious Area 20% coverage (about 60 square miles)Result is a decrease in Rock Springs Discharge of about 10-15% However, discharges at other springs are also decreased.
Figure 22-1: Groundwater flow along cross-section C-C before the increase of the impervious area
Flow versus distance • 70% of Rock Springs springflow comes from an area within 8 miles of Rock Springs. • Lake Apopka contributes to about another 5% of the flow at Rock Springs. • All based on the assumptions of the modeling efforts. Not verified…..
Estimation of yearly water budgets E = 44 P = 50 ET = 40 Watershed Q = ? F = ? Yearly Hydrologic Rates - inches
Unit Discharge is constant. Low Unit Discharge – more water is infiltrated.
Unit Discharge is constant. Low Unit Discharge – more water is infiltrated.
Land Locked 100% Vegetation Watershed E = 0 P = 50 ET = 40 Q = 0 F = 10 Yearly Water Budget - inches
Land Locked Lake E = 44 P = 50 ET = 0 Q = 0 F = 6 Yearly Water Budget (inches per year)
Discharge Lake E = 44 P = 50 ET = 0 Q = 6 F = 0 Yearly Water Budget (inches per year)Remember Lake Apopka Canal? 4.9 in/yr Most lakes both recharge and discharge during a year. The net yearly effect can be either discharge or recharge
Typical Watershed no DCIA, ~80% vegetation ~20% water surfaces P = 50 ET = 32.2 E = 8.8 Q = 0 F = 9 Recharge or Closed Watershed Water Budget inches per year
Typical Watershed no DCIA, ~80% vegetation ~20% water surfaces E = 8.8 P = 50 ET = 32.2 Q = 1-4 F = 5-8 Discharge/Recharge Watershed Water Budget inches per year
Typical Watershed 20% DCIA, ~60% vegetation ~20% water surfaces E = 8.8 P = 50 ET = 24 ED = 4 Q = 10 F = 3.2 Discharge/Recharge Watershed Water Budget inches per year
3D View 2D View Figure 1: Land surface elevations for a closed basin (unit: feet NGVD)
Total Watershed: 9.97 acres DCIA: 0.78 acre Pervious Nonirrigated: 5.49 acres Pervious Irrigated: 2.84 acres Irrigation Ponds: 0.86 acre Pervious + Irrigation Excess: 3.94 inches Figure 2: Land Use before tremendous urbanization for a closed basin (P = 50.0, E = 44.0, ET = 40.0, IET = 30.0, IA = 4.0, unit: inches/year)
Figure 3: Excess vs. increasing DCIA and constant Irrigation for the closed basin
Figure 4: Excess vs. increasing Irrigation and constant DCIA for the closed basin (Note: negative excess means water needs to be introduced into the basin)
Figure 5: Excess vs. increasing both DCIA and Irrigation for the closed basin
Conclusions • 1. Springflow is affected by the groundwater levels. • Recharge can be shown by modeling to affect spring flow and • Wetland conservation. • Mass balances on a yearly basis can assist in estimating • unknowns such as runoff or recharge. • Irrigation of detained stormwater can be built into • a stormwater management plan and cluster development • is an option to provide undisturbed land for irrigation.