Download
1 / 17
170 likes | 284 Views
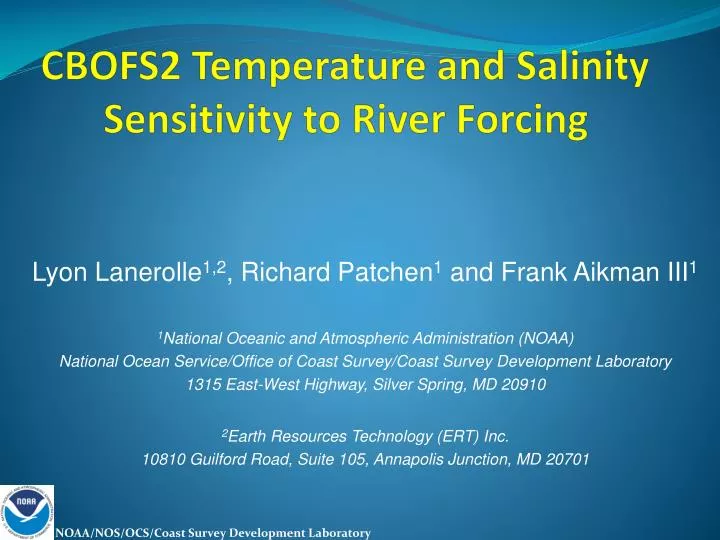
CBOFS2 Temperature and Salinity Sensitivity to River Forcing. Lyon Lanerolle 1,2 , Richard Patchen 1 and Frank Aikman III 1 1 National Oceanic and Atmospheric Administration (NOAA) National Ocean Service/Office of Coast Survey/Coast Survey Development Laboratory

E N D
CBOFS2 Temperature and Salinity Sensitivity to River Forcing Lyon Lanerolle1,2, Richard Patchen1 and Frank Aikman III1 1National Oceanic and Atmospheric Administration (NOAA) National Ocean Service/Office of Coast Survey/Coast Survey Development Laboratory 1315 East-West Highway, Silver Spring, MD 20910 2Earth Resources Technology (ERT) Inc. 10810 Guilford Road, Suite 105, Annapolis Junction, MD 20701
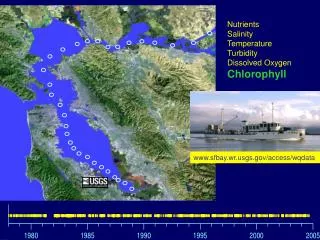
CBOFS2 Rivers for Forcing River volume discharge adjustment factors (Wen Long)
CBOFS2 Total River Volume Discharge Events Dry Periods
Summer Time Surface Temperature Temperature (oC) Temp. Difference (oC) Difference = CBOFS2 with new river Q weights – original CBOFS2 hindcast run
Summer Time Bottom Temperature Temperature (oC) Temp. Difference (oC)
Winter Time Surface Temperature Temperature (oC) Temp. Difference (oC)
Winter Time Bottom Temperature Temperature (oC) Temp. Difference (oC)
Summer Time Surface Salinity Salinity (PSU) Salt. Difference (PSU)
Summer Time Bottom Salinity Salinity (PSU) Salt. Difference (PSU)
Winter Time Surface Salinity Salinity (PSU) Salt. Difference (PSU)
Summer Time Bottom Salinity Salinity (PSU) Salt. Difference (PSU)
Summer Time Lower Bay Conditions Difference = CBOFS2 with new river Q weights – original CBOFS2 hindcast run
Summary and Conclusions • CBOFS2 river volume discharges need adjusting to compensate for ground, surface water effects, etc. • Effect of adjustments clearly manifested in the CBOFS2 T and S predictions • Spatial (horizontal) T and S differences at surface and bottom are similar • Differences in T mainly at Bay mouth, shelf and in tributaries and ± 1 oC • Differences in S more clearly seen specially in tributaries and are ± 1.5 PSU • T, S differences in Bay axis appear to get washed out to the Bay mouth & shelf • Spatio-temporal (depth vs. time) T, S differences show that : (i) in lower Bay they are localized near the surface but otherwise distributed throughout the water column, (ii) in upper Bay the differences are more stratified with less variations and (iii) Summer-Winter differences are not dissimilar