Download
1 / 24
240 likes | 372 Views
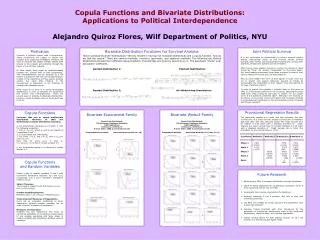
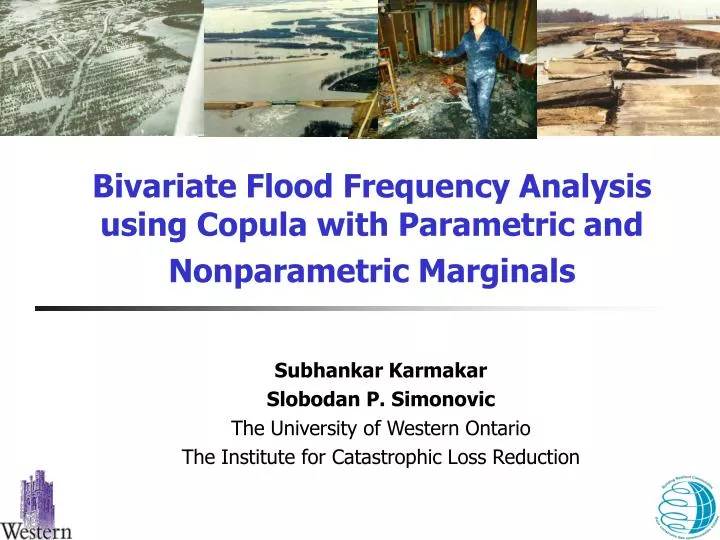
Bivariate Flood Frequency Analysis using Copula with Parametric and Nonparametric Marginals. Subhankar Karmakar Slobodan P. Simonovic The University of Western Ontario The Institute for Catastrophic Loss Reduction. Presentation outline. Introduction Objectives of the study Study area

E N D
Bivariate Flood Frequency Analysis using Copula with Parametric and Nonparametric Marginals Subhankar Karmakar Slobodan P. Simonovic The University of Western Ontario The Institute for Catastrophic Loss Reduction
4th ISFD Toronto Presentation outline • Introduction • Objectives of the study • Study area • Data and flood characteristics • Marginal distributions of flood characteristics • Parametric and nonparametric estimation • Joint and conditional distributions using copula • Conclusions
4th ISFD Toronto Flood characteristics Volume Duration Peak flow Introduction • Flood management (design, planning, operations) requires knowledge of flood event characteristics
4th ISFD Toronto Introduction
4th ISFD Toronto Introduction
4th ISFD Toronto Study objectives • To determine appropriate marginal distributions for peak flow, volume and duration using parametric and nonparametric approaches • To define marginal distribution using orthonormal series method • To apply the concept of copulas by selecting marginals from different families of probability density functions • To establish joint and conditional distributions of different combinations of flood characteristics and corresponding return periods
Red River Basin 116,500 km2 (89% in USA 11% in CDN) Flooding in the basin is natural phenomena Historical floods: 1826; 1950; 1997 Size of the basin and flow direction No single solution to the flood mitigation challenge 4th ISFD Toronto Study area
4th ISFD Toronto Study area - data • Daily streamflow data for 70 years (1936-2005) • Gauging station (05082500) - Grand Forks, North Dakota, US • Location - latitude 47°55'37"N and longitude 97°01'44"W • Drainage area - 30,100 square miles • Contributing area - 26,300 square miles • http://waterdata.usgs.gov
4th ISFD Toronto Study area – flood characteristics • Dependence between P, V and D • P and V highly correlated • All the correlations positive
4th ISFD Toronto Marginals - parametric
4th ISFD Toronto Marginals - nonparametric • Nonparametric kernel estimation of flood frequency • Orthonormal series method
4th ISFD Toronto Results
4th ISFD Toronto Results • P follows gamma distribution (parametric) and • V and D follow distribution function obtained from orthonormal series method (nonparametric) • Mixed marginals
4th ISFD Toronto Results • Second test
4th ISFD Toronto Copula • An alternative way of modeling the correlation structure between random variables. • They dissociate the correlation structure from the marginal distributions of the individual variables. • n - dimensional distribution function can be written:
4th ISFD Toronto Copula
4th ISFD Toronto Results – joint distributions Peak flow - Volume
4th ISFD Toronto Results – joint distributions Volume - Duration
4th ISFD Toronto Results – joint distributions Peak flow - Duration
4th ISFD Toronto Results – conditional distributions
4th ISFD Toronto Results – conditional distributions
4th ISFD Toronto Results – conditional distributions
4th ISFD Toronto Results – return period
4th ISFD Toronto Conclusions • Concept of copula is used for evaluating joint distribution function with mixed marginal distributions - eliminates the restriction of selecting marginals for flood variables from the same family of probability density functions. • Nonparametric methods (kernel density estimation and orthonormal series) are used to determine the distribution functions for peak flow, volume and duration. • Nonparametric method based on orthonormal series is more appropriate than kernel estimation.