Download
1 / 16
160 likes | 252 Views
Item # 9. CO 2 Emissions from Cars, Trucks & Buses in the Metropolitan Washington Region Presentation to the National Capital Region Transportation Planning Board Ronald F. Kirby Director of Transportation Planning June 20, 2007. Carbon Dioxide (CO 2 ) Methane (CH 4 ) Nitrous Oxide (N 2 O)

E N D
Item # 9 CO2 Emissions fromCars, Trucks & Busesin the Metropolitan Washington RegionPresentation to the National Capital RegionTransportation Planning BoardRonald F. KirbyDirector of Transportation PlanningJune 20, 2007
Carbon Dioxide (CO2) Methane (CH4) Nitrous Oxide (N2O) Hydrofluorocarbons (HFCs) Perfluorocarbons (PFCs) Sulfur Hexafluoride (SF6) Greenhouse Gases COG Climate Change Steering Committee, May 23, 2007
Emission Sources • Electricity • On-road Motor Vehicles • Solid Waste • Wastewater • Natural Gas/Home Heating Oil • Aviation, Rail, Construction, Agriculture • Substitutes to Ozone Depleting Substances • Land Use, Land Use Change, and Forestry COG Climate Change Steering Committee, May 23, 2007
US Greenhouse Gas Emissions by Sector Source: EPA 2004 National GHG Inventory COG Climate Change Steering Committee, May 23, 2007
Estimates of CO2 Emissions from Mobile Sources (Cars, Trucks & Buses) in the Metropolitan Washington Region • 8-hour Ozone Non-Attainment Area (map on next slide) • 2006 CLRP, Round 7.0a Cooperative Forecasts • 2005 Regional Fleet Inventory(New Inventory scheduled for 2008) • EPA Mobile 6.2 Emissions Model
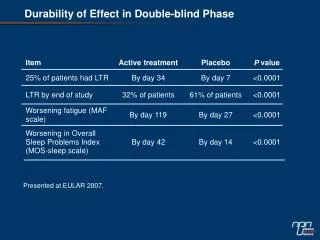
Annual Mobile CO2 Emissions (Tons) for 8-Hour Ozone Non-Attainment Area Note: Years 2000, 2005 and 2020 were interpolated using 2002, 2010 and 2030 emissions estimates from the October 18, 2006 conformity determination.
2002-2030 Changes in Households, Employment, VMT, NOx, VOC and CO2 for the 8-Hour Ozone Non-Attainment Area
Vehicle Fleet and Demographic Data for the Washington Region by State Presentation to the Transportation Planning Board, May 17, 2006
California Low Emission Vehicles II (CAL LEV II) • More stringent emissions standards for greenhouse gases (CO2, methane, nitrous oxide) and other pollutants • Applies to automobiles and light trucks starting with the 2009 model year • California requested EPA waiver in December 2005; not yet granted • Eleven other states including Maryland plan to adopt CAL LEV II, and another six states are considering these standards
Reductions in Annual CO2 Emissions with Regionwide CAL LEV II Vehicles
Reductions in Annual CO2 Emissions (Millions of Tons) with Regionwide CAL LEV II Vehicles
Additional CO2 Reductions Could be Achieved through Reductions in Vehicle Miles of Travel (VMT) • Travel Demand Reduction Strategies such as Telecommuting, increased transit and ridesharing • Land Use/Transportation strategies such as the TPB RMAS Scenarios • Current programs/scenarios reduce 2030 VMT by one to two percent
2030 Household and Employment Growth:TPB Transit Oriented Development Scenario
Conclusions • VOC and NOx mobile emissions are declining significantly even though overall vehicle travel is growing, due primarily to cleaner vehicles and fuels • CO2 mobile emissions are growing steadily. To achieve CO2 reductions we need to: • Reduce CO2 emissions per vehicle mile (e.g. California greenhouse gas emissions standards, Federal CAFE Standards) • Reduce vehicle miles of travel (Demand management, land use/transportation strategies)