Download
1 / 45
450 likes | 584 Views
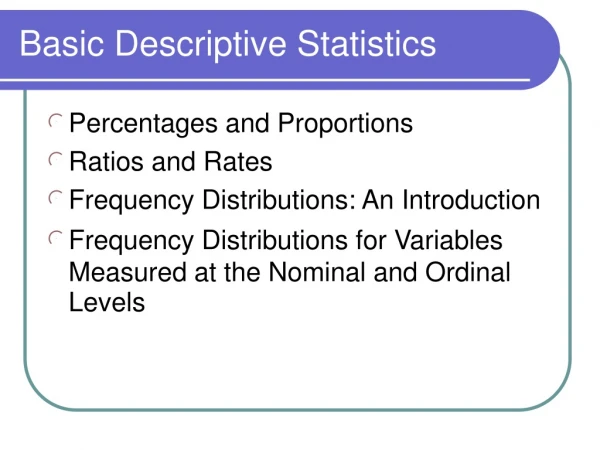
Basic Descriptive and Inferential Statistics. Analytical Techniques for Public Service The Evergreen State College Winter 2010. Where are we? You Have:. Identified your problem/research question; Described why the issue is worth studying;

E N D
Basic Descriptive and Inferential Statistics Analytical Techniques for Public Service The Evergreen State College Winter 2010
Where are we?You Have: • Identified your problem/research question; • Described why the issue is worth studying; • Conducted a literature review to see what others have done and to shed more light on your question; • Identified and operationalized your measures; • Identified a research design that is capable of answering to some degree your research question; • You will soon be in the field collecting your data; Now What??
Preparing Your Data for Analysis • Prepare code categories (e.g., 1 = female; 2 = male); • Prepare a codebook (this tells you the location of data and the meaning of the codes in a data file). • Create a data file based upon the codebook (e.g. Excel, SPSS, SAS, JMP8, ASCII). • Once the data are entered and “cleaned” and made “analysis ready” we are ready for analysis.
Valuable Books for Your Arsenal Stevens, J. (2002) Applied Multivariate Statistics for the Social Sciences. Lawrence Erlbaum Associates; 4th Ed. Blalock, H. (1979) Social Statistics McGraw Hill; Revised 2nd Ed. Kraemer, H and Thiemann, S. (1987) How Many Subjects: Statistical Power Analysis in Research. Sage Publications. Babbie, E. (2009). The Practice of Social Research. Wadsworth Publishing; 12th Edition.
What will be Considered • Descriptive vs Inferential Statistics • Basic Terminology • Levels of measurement • Strength of Association • Hypothesis testing • Type I and Type II Errors and Statistical Power
Subject Matter of Statistics • Descriptive Statistics - Tools and issues involved in describing collections of statistical observations, whether they are samples or total populations. • Inferential Statistics (inductive statistics) - Deals with the logic and procedures for evaluating risks of inference from descriptions of samples to descriptions of populations (finite or infinite). Loether, H and McTavish, D. (1976) Descriptive and Inferential Statistics
Basic Terms • Variable (an attribute of a person or object that can take on different values). • Distribution of a variable. • Continuous or discrete variables • Central tendency • Range • Dispersion/confidence intervals • Levels of Analysis
Measures of Central Tendency Central tendency: The 3-Ms: Mode, Median, Mode. • Mode: most frequent response. • Median: mid-point of the distribution • Mean: arithmetic average.
Standard Deviation • Normal Distribution: Bell-shaped curve • 68.26% of the variation is within 1 standard deviation of the mean • 95% of the variation is within 1.96 standard deviations of the mean
Applying the Standard Deviation Average test score= 60. The standard deviation is 10. Therefore, 95% of the scores are between 40 and 80. Calculation: 60+20=80 60-20=40.
ExerciseConfidence Intervals Calculate and interpret a 95% confidence interval for these data. -
Variable types Continuous variable – Attributes are a steady progression (income, age). No gaps. Discrete variable – Attributes are separated: gappiness (gender, religious affiliation, race)
Analysis • Univariate Analysis – Single Variable • Bivariate Analysis – Analysis of two variable simultaneously • Multivariate Analysis – Analysis of simultaneous relationship of several variables.
Level of Measurement • Nominal Data: Categorical (e.g., gender, race) • Ordinal Data: Nominal + More/less than (e.g., social class, religiosity) • Interval Data: Nominal + Ordinal + How much more/less than. Categories have a standard unit of measure (e.g., Fahrenheit). • Ratio Data: Nominal + Ordinal + Interval + a true zero (e.g., age, height).
Levels of Measurement and Statistics Tests 1st Variable 2nd Variable- Blalock, Social Statistics
Measures of Association • A class of statistical tests that are used to show the magnitude or strength of a relationship between variables. • Significance tests are used to establish whether or not a relationship exists, and measures of association show the size of the relationship (weak, moderate, strong). • Some also show the direction of the relationship ( for ordinal and interval-ratio variables).
Measures of Association for Cross Tabulations (examples) • Lambda: The strength of a relationship between two nominal variables. • Phi: The strength of a relationship between two dichotomous variables. • Gamma: The strength of a relationship between two ordinal variables. • Values Range between 0 and + or – 1. • Negative and positive values show the direction of the relationship, where applicable. • The closer the value is to one, the stronger the relationship.
Proportional Reduction of Error (PRE) • PRE: Proportional Reduction of Error: The concept underlying these tests where: • The errors of prediction made when the independent variables is ignored (E1) and the errors of prediction made when the prediction is based on the independent variable (E2) are taken into account. • If you know information about one variable, to what extent will that data help you predict information about another variable?
General PRE formula # of errors not knowing ind var (minus) # of errors knowing ind var ---------------------------------------------------------------- # of errors not knowing ind var
Are homeless people reporting mental health problems more likely to request case management than those who don’t? Exercise : Calculate Lambda and Interpret
Reading Tables • Independent Variable: Mental health problems • Dependent variable: Wants Case management • Are those that have mental health problems more likely to say they will want case management? • For each category of the independent variable, what is the percent distributions across the dependent variable? • Percent distribution down columns
Lambda • An asymmetrical measure of association: the value varies depending on which variable is independent. • Ranges from 0 to 1 • Formula: • Lambda= E1-E2 E1
Instructions to Calculate Lambda • 1. Calculate E1: Find the mode of the dependent variable (the attribute that occurs the most often) and subtract it from N (sample size). E1=N-ƒ of the mode • 2. Calculate E2: Find the mode in each row (i.e., category of the independent variable). Subtract each value from the row (category) total and add them together. E2=(Row total – row mode) + (Row total – row mode) for all attributes of the independent variable.
Are homeless people reporting mental health problems more likely to request case management than those who don’t? E1: 1164-648=516 E2: (512-355) + (652-359)=450 Lambda=.128
How likely is it that you will have sexual intercourse in the next year?
How likely is it that you will have sexual intercourse in the next year? By Gender χ2 = 49 p < .001 Lambda = .04
How likely is it that you will have sexual intercourse in the next year?By Drink Alcohol χ2 = 108 p < .001 Lambda = .21
Steps in Conducting Hypothesis Testing • State the null hypothesis and alternative.; • Determine if the test will be one or two tailed; • Determine the level of measurement of your variables; • Set the alpha level (consider power of the test). • Identify the statistical test and assumptions for each relationship.
Common Distributions • Population Distribution • Sample Frame • Sample Distribution • Sampling Distribution
Common Sampling Distributions • Chi Square • Student’s t • F Distribution • Normal Distribution
Chi Square Chi square is computed based on a comparison of actual frequencies observed in a sample to that which would be expected to occur by chance alone. If there is a large difference between the observed vs. the expected frequencies, a large value for Chi square will be obtained.
T-test Definition: The t-test is used to determine whether the difference between means of two groups or conditions is due to the independent variable, or if the difference is simply due to chance. (test of independence and paired samples tests)
One-way ANOVA • Definition: As with the t-test, ANOVA also tests for significant differences between groups. But while the t-test is limited to the comparison of only two groups, one-way ANOVA can be used to test differences in three or more groups.
Sexual Behavior IntentScale Score(5 = High Risk) P < .001; Eta2 = .16
Other Interesting Terms • Assumption (e.g., normal distribution) • Assumption Robustness (Leeway one has in violating an assumption)
Type I and Type II Errors Type I: Rejecting a null hypothesis when it is true – Saying groups differ when they do not. Type II: The probability of accepting a null hypothesis when it is false – Saying groups do not differ when they do. Power: The probability of rejecting a false null when it is false – the probability of making a correct decision.
Setting Type I and Type II Errors H0 : Drug is unsafe. H1 : Drug is safe. H0 : Defendant is innocent. H1 : Defendant is guilty.
Alpha, Beta, and Power(N = 15) a β 1-β .10 .37 .63 .05 .52 .48 .01 .78 .22 Stevens: Applied Multivariate Statistics for the Social Sciences
Power and N size n (subjects per group) power 10 .18 20 .33 50 .70 100 .94 Stevens: Applied Multivariate Statistics for the Social Sciences
Exercise: True or FalseTo achieve the same power: • More subjects are needed for a 1% level test than for a 5% level test. • Two-tailed tests require larger sample sizes than one-tailed tests. • The smaller the critical effect size, the larger the necessary sample size. • The larger the power required, the larger the necessary sample size. • The smaller the sample size, the smaller the power – the greater the chance of failure.