Download
1 / 21
220 likes | 407 Views
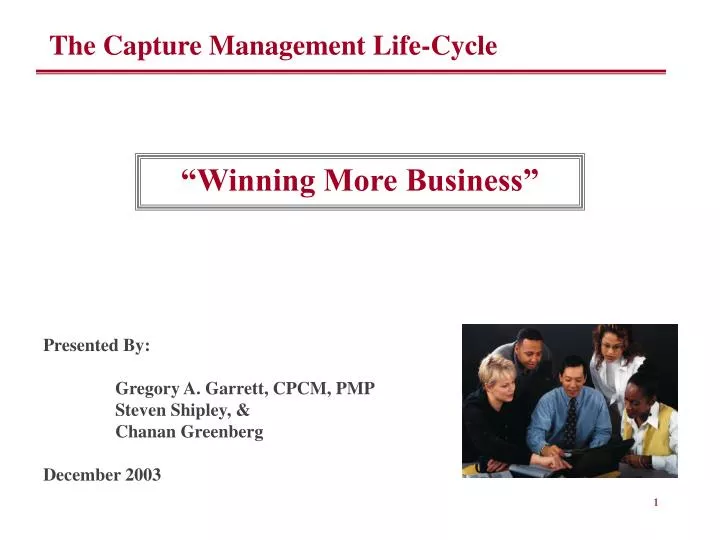
The Capture Management Life-Cycle. “Winning More Business”. Presented By: Gregory A. Garrett, CPCM, PMP Steven Shipley, & Chanan Greenberg December 2003. 1. The Capture Management Life-Cycle. Key Topics of Discussion:. The World WE Live In! Creating Value for Customers

E N D
The Capture Management Life-Cycle “Winning More Business” Presented By: Gregory A. Garrett, CPCM, PMP Steven Shipley, & Chanan GreenbergDecember 2003 1
The Capture Management Life-Cycle Key Topics of Discussion: • The World WE Live In! • Creating Value for Customers • The Capture Management Life-Cycle 2
New SupplyEnvironment SupplyDrivers • Growth of Internet architecture • Continued Growth of wireless technology product and software applications • Rapid growth of Enterprise software tools Pros+ Wider range of products and services + More modular products and services + Improved price/ performance + Accelerated pace of change Cons - More complexity- Higher cost of integration- Less reliability- Accelerated pace of change- Rapid Obsolescence Technology • Increased U.S. Government focus on outsourcing and Privatization. • Increased pricing flexibility • More demanding Buyers with special focus on Past Performance Regulation Dramatic Increase in Products and Services Choices for Customers The World WE Live In 3
Creating Value for Customers SupplyChain Management SupplyChain Management Quality of Service On-TimeDelivery Speed Maintainability Best in Class Service Best in Class Products Capacity Trust Trust Availability of Resources Breakthrough Technology Reliability On-TimeDelivery Price Trust Type of Contract Discounts Best Value Deal Payment Terms Financing Relationship Quantity Third Parties Customer Loyalty Value 4 From: The Capture Management Life-Cycle, by Gregory A. Garrett and Reginald J. Kipke, CCH 2003, pg. 4
The Capture Management Life-Cycle 5 Reference Text, pg. 15
The Capture Management Life-Cycle (Phases & Stages) 6 Reference Text, pg. 27
A Case Study for Transforming the Business Development Enterprise Applying the BD-CMM® -- Business Development Capability Maturity Model® in Real Time Presented by Steve Shipley, President & CEO, Shipley Associates Capability Maturity Model® and CMM® are registered trademarks of Carnegie Mellon Software Engineering Institute
Agenda • What is the BD-CMM? • Understanding the Fundamental Case – A Real Life Example • Attachments • Understanding the Origins of the BD-CMM • Partnering for Business Development Excellence
What is the BD-CMM? What is it? How does the BD-CMM fill a void in current industry?
Being developed primarily as a framework, guide, and path for managing and improving business development processes • Not currently envisioned for process certification BD-CMM Strategic Objectives • Provide a Framework • Description of key elements of business development • Describe a Path • Evolutionary business development improvement path • Give support from a Guide • Key practices for measuring and managing business development performance
CUSTOMER BD-CMM CMMI SW-CMM SA-CMM SE-CMM HR-CMM PM-CMM COMPANY BD-CMM, Other CMMs, and CMMI • Addresses major void in CMM family • Typically not addressed in business process reengineering (BPR) • Provides “customer-facing” dynamic to CMM integration • Complements Project Management CMM (PM-CMM) in seeking to improve the customer interface
Understanding the Fundamental Business Case What is the business development challenge? How does the BD-CMM envision success? What are the potential benefits? Is there a compelling value proposition? What’s the resulting business case?
BD-CMM Level-2 BD-CMM Level-3 BD-CMM Level-4/5 Capture Ratio Capture Ratio Capture Ratio Win Rate Win Rate Win Rate Emerging Benchmark Concept Note: Projections based on data collected during APMP Benchmark Study 2002, prior national benchmark studies, and Shipley process consulting experience
BD-CMM Bottom Line Benefits Process Continuum Focus: Many Small, Routine Opportunities Focus: Few Large, Strategic Opportunities Note: Projections based on data collected during APMP Benchmark Study 2002, prior national benchmark studies, and Shipley process consulting experience
Managed Implementation: Mid-size company in the Washington DC area IT services industry Federal, state, and local government markets Aggressive growth targets Broad-based process development in partnership with Shipley Effort begun in January 2003 Implemented BD-CMM Level 1 in January 2003 Level 3 by end of July 2003 RESULTS: Value Proposition… Real Results! 1200 65% 150% 100% 30% 2002 2003 YTD 2003 Sales by Mid-Year 400 2003 Annual Goal 2002 2003 YTD Number of Proposals Win Rate Annual Sales
Business Case… What Success Really Means! • Assumptions at BD-CMM level 1: • $250M annual revenue, with average 2-year turnover • 5% reinvested in BD = $12.5M • 2% allocated to proposals = $5M • 1200 proposals/year at a cost of $4.2K per proposal • 30% win rate • 360 wins per year to maintain $125M turnover • Average value of proposals won = $347K • Relative proposal process inefficiency = 35% (minimum) • Note: Notional analysis not based on actual client costs
Business Case… What Success Really Means! • Assumed cost of BD-CMM implementation to grow capability from level 1 to level 3: • Scenario #1 – Managed services • Change management provided by outside consultants • Typical project duration of 6-12 months • $250K for outside process services, training, etc. • $500K for internal costs and charges • Scenario #2 – “Organic” development • Change management provided by inside personnel • Typical project duration of 18-24 months • $1000K for internal costs and charges • Note: Notional analysis not based on actual client costs
Business Case… What Success Really Means! (cont’d) • Benefits derived at BD-CMM level 3: • $375M annual revenue, with average 2-year turnover • $125M increase in annual revenue • 3.3% reinvested in BD = $12.5M (constant) • 1.0% allocated to proposals = $3.75M (reduced due to greater efficiency) • 400 proposals/year at a cost of $9.4K per proposal • 65% win rate • 260 wins per year to maintain $188M turnover • Average value of proposals won = $723K
Business Case… What Success Really Means! • Calculated return on investment: • 1.7% gain in BD effectiveness = $6.4M to “bottom line” • Return on investment • Managed services ($6.4M ÷ $0.75M)= 8.5 to 1 • Organic development ($6.4M ÷ $1.0M) = 6.4 to 1 • Note: No other cost impacts considered in calculation
Summary Why should you implement the BD-CMM in your organization? Where can you get additional information?