Download
1 / 34
340 likes | 555 Views
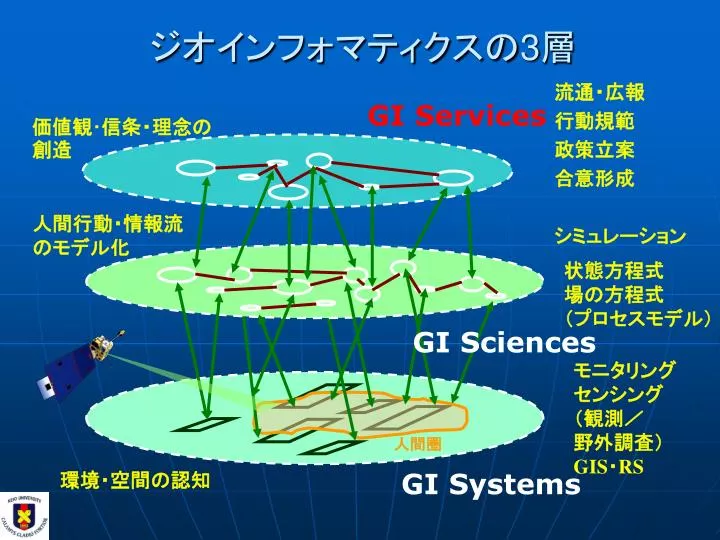
ジオインフォマティクスの 3 層. 流通・広報 行動規範 政策立案 合意形成 シミュレーション. GI Services. 価値観・信条・理念の創造. 人間行動・情報流 のモデル化. 状態方程式 場の方程式 (プロセスモデル). GI Sciences. モニタリング センシング (観測/ 野外調査) GIS ・ RS. 人間圏. GI Systems. 環境・空間の認知. GI System. リアルタイムな環境センシング. 様々な地球観測衛星.

E N D
ジオインフォマティクスの3層 流通・広報 行動規範 政策立案 合意形成 シミュレーション GI Services 価値観・信条・理念の創造 人間行動・情報流 のモデル化 状態方程式 場の方程式 (プロセスモデル) GI Sciences モニタリング センシング (観測/ 野外調査) GIS・RS 人間圏 GI Systems 環境・空間の認知
様々な地球観測衛星 Longer-term Missions - Observation of Key Earth System Interactions Aqua Terra Landsat 7 Aura ICEsat Jason-1 QuikScat Exploratory - Explore Specific Earth System Processes and Parameters and Demonstrate Technologies Triana GRACE SRTM VCL Cloudsat EO-1 PICASSO
High Resolution DEM Invest 7.8 billion Yen in 3years For 10~20cm DEM in total Japan
legend Flora 1 Flora 2 Flora 3 Flora 4 Flora 5 Flora 6 Flora 7 Etc, Object-based Classification for Forest Mapping
Integrated Model for Flood Risk Management Detailed landcover information Damage Classification Questionnaire survey & historical data Development of fragility (or stage-damage) functions Establish damage estimation model for each landcover feature DHM supplies: Flood data on each grid (distribution, depth and duration) Flood Damage Estimation in each grids using established models for each type of damage. Output: estimated distributed flood damage Distributed Hydrologic Model Damage Estimation Model source : Dushmanta Dutta (Tokyo Univ.)
大気汚染NOx Road Traffic 交通量 • - 3 • - 10 • - 20 • - 30 • 47.17 • (hundreds cars per 12 hours) - 0.002353 - 0.006782 - 0.011211 - Mean - 0.01564 - 0.020068 - 0.024497 - 0.028926 - 0.033355 - 0.037784 - 0.090717 ppm / h
Object based Visualization 3D Biomass Volume for CO2
Mobile Real time GIS ( Sensing and LB Services) • Geo-browser on a PDA • on-site data entry • GPS enabled • Navigation • soon/now • all the above AND wireless connectivity
“No Limits” Display http://www.comicro.com/
Hazard Map informed through WEB Mapping Landslide Hazard Map http://anshin.sharaku.nuac.nagoya-u.ac.jp/anzen/index.html Flood Hazard Map http://www.city.tajimi.gifu.jp/section_news/kikaku/bousai.htm
RISK Analysis Services by WebGIS Volcano Fault
発言に地図を貼り付けて議論 地図をクリック!
GIS in the Office of Emergency Management Original OEM in WTC Complex Bldg 7
INSPIRE objectives Make relevant, harmonised spatial data available for Community Environmental Policy (formulation, implementation, monitoring and evaluation) and for the citizen ... … through the establishment of integrated spatial information services, based upon a distributed network of databases, linked by common standards and protocols to ensure compatibility.
Meteo data Catchments Infrastructure for Spatial Informationin Europe Technical Support to GI policy development Europe is moving 3cm/ year Different Policies and standards Standards implementation GI Institutional framework GI technical standards Different sea level in Europe Spatial Data Infrastructure Technical Support To data set creation GIS for Natura 2000 Spatial Information Services Fundamental and thematic GI data sets GIS to manage Natura2000 sites Needs to create european spatial data sets eEurope : eGovernement on line Land Cover
INSPIRE: Example of result Natura2000 sites Natura2000 db species, habitats LIFE Nature project locations Areas eligible for Structural Funds (Ob. I,II) CORINE Land Cover Administrative Regions Agri-environment schemes
GMES production concept Statistical Mapping Institutes for Environmental EO from Institutes agencies Nat.Ressources: monitoring : Air, Space Data providers Geology, Climate, Water, Wastes, Soils, Oceans, Noise Nature Data users __________ Information Providers Public Institutes Private Users Research Models (EU, nat., reg. local) Consultancy requirements organisms EEA, JRC Offices Information users Policy, Public Interest groups Administration
ssssssssss sssssssss sssssssss ssssss ssssssssss sssssssss sssssssss ssssss air Base water Base From Monitoring to reporting The EEA framework to provide policy relevant information REPORTING EEA reports/EERC explain & communicate ASSESSMENT analyse & understand indicators INFORMATION visualize & describe graphs & maps European databases DATA soil Base store & manage ETC Topic Databases waterNet soilNet airNet MONITORING measure & record EIONET national databases